Apr 24, 2012
Key Strategy Issues Vol.K294
The U.S. economy appears to be advancing to a new phase
The world’s only economy with the power to achieve medium to long-term growth
U.S. stock prices have doubled since the market hit bottom after the bubble burst. Although U.S. stocks fell 20% in 2011 because of the crisis in Greece, they subsequently rallied to cover this downturn and climb to within 10% of the all-time high that was reached prior to the collapse of Lehman Brothers. But in Japan, stock prices have increased only 30% from the low after the Lehman shock. Are U.S. stocks showing us what is ahead for global stock markets (A)? Or are Japan’s lackluster stocks an indicator of the future (B)? Many people apparently believe that Japan is the leading indicator. They think that the world will go down the same path that Japan did: the end of an asset bubble followed by a deep economic downturn and deflation. So should we believe in outlook (A) or (B)? If we choose (A), global economic growth will continue and there will probably be a powerful Japanese stock market rally as Japan’s stocks catch up with the rest of the world. If we choose (B), global economic growth will stop and deflation will start. These events could spark a severe drop in U.S. stock prices. Investors and corporate executives must both base their decisions on one of these outlooks. My choice is (A). I believe that the global economy will continue to grow without becoming entangled in the deflation that happened in Japan. This will create an enormous opportunity for Japanese stocks. The key to achieving this growth is not Europe or China. Whether or not (A) happens will depend entirely on a recovery of the U.S. economy, which is still the nucleus of the global economy. The United States has finished the correction after the Lehman Brothers collapse and is building an increasingly stronger base for medium-term growth. Furthermore, ideological pessimism about the U.S. economy that is not based in facts has become widespread. Now is the time for multi-faceted analysis of the U.S. economy that uses data. This report is a summary of the presentation I gave on February 10, 2012 at The Securities Analysts Association of Japan.
Contents
1. The decisive elements of U.S. strength and long-term growth potential 2. Contradictions that confuse the U.S. economic outlook and the economy’s driving force 3. The gap between interest rates and profit margins = The unprecedented risk premium 4. Using 100 years of the U.S. DJIA to view economic and stock market development ? Three sources of energy 5. Limitations on growth ? How should we view the U.S. debt problem? 6. The U.S. structure for long-term growth is sound
Chapter 1 The decisive elements of U.S. strength and long-term growth potential
Pessimism about the United States has emerged over the years on many occasions. But the pessimists were always wrong. In 1993, a book titled America ? The Rebirth of Capitalism (Toyo Keizai Inc.) explained why the U.S. economy would come back. At that time, most people were pessimistic about the U.S. economy. But once again the United States staged a recovery that was stronger than expected. People in Japan have a tendency to adopt a negative view of the United States. But I think this is a stance that threatens the future of Japan and its business sector. The following section is an explanation of the basis for this belief and the supporting data.
The only major country with medium/long-term growth in its working population
As in the past, still more time will be needed to unify the global economy, with the United States at the center in terms of the economy as well as military strength and politics. I will begin by listing primary examples of factors that will support medium and long-term growth in the United States. The first example is the U.S. population, which is shown in Figure 1. According to a United Nations forecast, the working population (age 15 to 65) will decrease in China, Europe, South Korea and Japan after reaching a peak between 2010 and 2015. Among countries with a certain level of industrialization, only the United States is expected to achieve long-term growth in its working population. The second example is the shale gas extraction revolution, which has caused U.S. natural gas prices to plummet. Falling energy prices will probably contribute to a higher medium-term U.S. economic growth rate. Petroleum imports were about 1% of nominal GDP in Japan and the United States in the 1990s. In 2008, these imports were more than 3% of the U.S. GDP and almost 4% of Japan’s GDP. But in 2011, these percentages were down to 2.9% in Japan and 2.2% in the United States (Figure 2). This percentage, which is an indicator of the U.S. reliance on imported energy, will most likely return to 1% or even less. As a result, the United States will probably be a major beneficiary of the new energy revolution. Figure 1: Workforce trends forecast by country (2000=100) Figure 2: Import amount of petro and products /nominal GDP for Japan and US 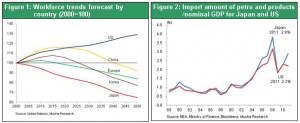
The most efficient labor market and most vigorous creative destruction
The third example is the U.S. labor market, which is the most efficient in the world from a medium and long-term perspective. Figure 3 shows the relationship between the unemployment rate and economic growth rate, which is known as Okun’s law, in major countries. As you can see, there is a strong correlation between these two figures. Figure 3 shows that the United States has the world’s most elastic labor market. The reason is that companies quickly lay off workers when the economy weakens even slightly. Since this is not possible in Japan, its labor market is the world’s most rigid. Labor market efficiency is a vital source of energy in a market economy for the restoration of balance. No country can perform creative destruction as quickly as the United States. As a result, the fourth example is the consistently high rate of metabolism in the United States. The U.S. economy is constantly producing newcomers. Figure 4 shows the stock prices of prominent IT companies (Unisys, Microsoft, Google, Amazon, Apple). Over the years, the leading company has been replaced by another again and again. Three to four decades ago, the leading IT companies were IBM and Unisys, which produced mainframe computers. Next was the PC era with Intel and Microsoft at the forefront. Google and Apple were next. And now we are about to advance to the age of Facebook, which will soon conduct its IPO. In cycles of less than 10 years, new leaders of the IT industry have emerged. Moreover, many of the new leaders have been companies that had been operating for only a few years. This demonstrates that the United States has consistently enabled younger generations to take the lead in the economy. The United States is still supreme in terms of military and political power. But there is also no doubt that the United States is far ahead of other countries as an economic superpower, too. Figure 3: International comparison: Unemployment change vs GDP change Figure4: Stock prices of Leading US IT Co. (each company’s peak prices=100) 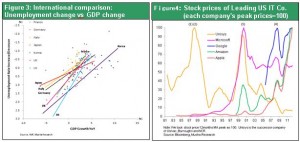
Chapter 2 Contradictions that confuse the U.S. economic outlook and the economy’s driving force
The struggle between unprecedented earnings and record postwar unemployment
Now let’s look at the U.S. economy from a short-term perspective. The consensus in Japan is apparently that the worst is not yet over in the United States. But the U.S. stock market has adopted an optimistic outlook. Today, the U.S. economy has extremely differing aspects that are somewhat like Jekyll and Hyde. This dichotomy makes it difficult to understand the U.S. economy. Two significant contradictions exist. First, even though companies have been reporting record earnings for more than one year (Figure 5), no recovery in jobs has taken place. During the downturn after the Lehman shock, the United States shed 8.8 million jobs, the biggest loss in the postwar era. Furthermore, the subsequent rebound in jobs has been extremely sluggish (Figure 6). Record earnings and record postwar job losses exist side by side. Consequently, the view of the U.S. economy differs depending on whether one looks at earnings or unemployment. Figure 5: US Corporate profits after tax Figure 6: US Employment and recession 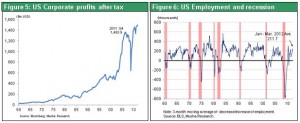
The productivity revolution is lowering labor’s share of income
A big drop in labor’s share of income is behind this contradiction. This share has declined to the lowest point since 1960 (Figure 7). The result is the appearance that companies are posting record-high earnings by forcing workers, who are in a position of weakness, to accept sacrifices like layoffs limitations on salaries. This inequality is also a problem with the market economy and is viewed as a cause of the U.S. economy’s sickness. However, this view is wrong. Higher earnings resulting from labor cost cuts are simply one side of the story. Increasing productivity is the most significant story. In fact, productivity in the manufacturing sector has staged a powerful recovery after the drop sparked by collapse of Lehman Brothers (Figure 8). Figure7 : US Labor distribution rate and recession Figure 8: US Labor productivity (Output per hour) 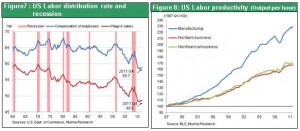
The age of the cloud and intelligent terminals
Productivity is increasing at an unprecedented rate in sectors other than manufacturing, too. Relentless progress regarding globalization, the Internet and other components of the IT revolution has been pushing productivity up. Currently, it is said that world of networks has become the world’s seventh continent. First was the online centralized processing age of mainframe computers. Next was the dispersed processing and LAN era of PCs and servers. Today, we are in the age of cloud computing and the associated intelligent terminals (smartphones, tablets, PCs and other devices). This age has created an entirely separate community. Another result is the birth of entirely new political power like the Arab spring. Furthermore, the Internet provides instant access to information anywhere in the world and the data needed for economic analysis. So the evolution is still going on. All these events have triggered a productivity revolution and business model evolution on an unprecedented scale. Companies are constantly reexamining their business models as they purchase the latest technologies and equipment. Executives must reallocate corporate resources from a global standpoint. Technological changes are occurring everywhere in the world. But unemployment is particularly high in the United States because the economy’s very high elasticity allows companies to quickly adapt to new environments for business activities. The replacements of leading U.S. IT companies that I discussed earlier signaled the occurrence of these shifts in the technological environment. Next, let’s examine changes in unemployment and GDP growth rates. During the economic downturn in 2009, the U.S. GDP growth rate was negative 2.6%. The unemployment rate rose by 3.5 points from 5.8% to 9.3%. In Japan, the GDP contracted by a much larger 5.3% but unemployment increased by only 1.1 point from 4.0% to 5.1%. In Europe, the GDP contracted 4.1% but unemployment was up only 1.9 point, rising from 7.5% to 9.4% (Figure 9). In Japan and Europe, workforce reductions were unable to keep up with the drop in production. Higher unemployment in the U.S. economy was therefore linked to the improvement in productivity. As a result, we can expect the U.S. unemployment rate to decline. I adopted the same stance following the Lehman shock and my view is exactly the same today as well. Figure 9: Changes in unemployment rate and GDP (2009) Figure 10: US Discretionary spending as a percentage of nominal GDP 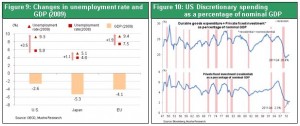
Low demand vs. High savings
In addition to the contradiction of high earnings along with high unemployment, the U.S. economy has the contradiction of the weakest demand in the postwar era along with the highest-ever level of savings. Figure 10 shows U.S. discretionary spending (purchases of durable goods and private-sector investments (housing + non-housing)) as a percentage of GDP. In the past, this percentage has repeatedly increased with economic upturns and decreased with downturns. Prior to the Lehman shock, discretionary spending reached a peak of more than 25%. As the U.S. economy declined, this percentage fell all the way to a new postwar low of 19%. Discretionary spending was excessive before Lehman Brothers collapsed but subsequently has been held to an extremely low level. Housing is the primary cause for the drop in discretionary spending. As a percentage of the GDP, U.S. housing investments reached a high of 6% before the Lehman shock and then plunged to the current 2% level. Home sales are now about 300,000 units per year, far below the almost 1.4 million annual sales of homes before the Lehman shock. Automobile sales are also sluggish, although demand for automobiles is recovering somewhat in relation to housing demand. Annual U.S. automobile sales are currently about 14 million vehicles, which is still low in comparison with sales in prior years (Figure 11). Figure 11: US Sales of new passenger cars and single-family houses Figure 12: US Corporate - Cash Flow, Investment and Surplus 
Unprecedented corporate balance sheet liquidity and shareholder distributions
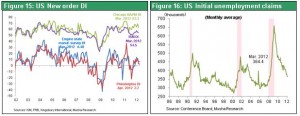
Despite this weak demand, private-sector savings are at an all-time high. Most significantly, companies have an extremely large volume of excess cash. As Figure 12 shows, cash flows at U.S. companies have been consistently posting strong growth even as the economy declined after the Lehman shock. Why? Companies preserved cash flows by cutting their workforces as sales dropped. At the same time, they cut back capital expenditures. The result was even more growth in excess funds. A large share of these funds is being used for stock repurchases, which now total a very high 4% of total U.S. stock market capitalization. Adding the average dividend yield of 2% for U.S. companies results in an aggregate shareholder distributions of 6% of a company’s market capitalization (Figure 13). The U.S. household saving rate increased significantly after the Lehman shock, too. Although this rate has subsequently been decreasing, U.S. households are still saving money at the highest rate in the past 20 years (Figure 14). Figure 13: US stock dividend and share-buyback yield and Corporate Bond Yield Figure 14: US Saving rate 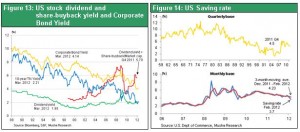 These facts lead to the conclusion that the cause of sluggish demand is the desire to save rather than spend, not a shortage of money to spend. So the problem is corporate and consumer sentiment. However, the new order DI and number of initial claims for unemployment insurance, which are short-term economic indicators, are finally showing signs of an improvement (Figures 15, 16). Initial unemployment claims fell to 350,000 in 2012 spring from the peak of 650,000 after the Lehman shock. The number of current claims has almost dropped to the level that has always immediately preceded a strong economic upturn in prior years. I therefore believe that another U.S. economic downturn is very unlikely to occur. Figure 15: US New order DI Figure 16: US Initial unemployment claims
Houses have become significantly underpriced
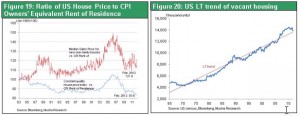
Growth in housing investments is a key element of the forces behind the U.S. economic recovery. These investments fell to 2.3% of GDP at one point. Even a recovery to only the 3% or 4% level would make a big contribution to the upward momentum of the U.S. economy. Houses are definitely underpriced despite the absence of any indications that prices will start recovering. Figure 17 shows the market value of real estate owned by households as a percentage of nominal GDP. Household real estate surged from approximately 120% of GDP in the 1990s to a peak of about 190% in the past decade. Today, this figure is back to 120%. The housing affordability index of the National Association of Realtors (Figure 18) stayed between 120 and 140 during the 1990s. During the housing bubble, the index fell to 100 but is currently more than 200. From the standpoint of affordability, houses have clearly become underpriced. Furthermore, mortgage interest rates are low. From a long-term perspective, this is an excellent opportunity to buy a house. As Figure 19 shows, the home price-to-rent ratio is now at a record low, one more indicator that houses are underpriced. However, there are no signs of a recovery because of the large number of houses for sale. Foreclosures are a major reason for the decline in home prices because of the immense selling pressure created by these properties. Although lower than at its peak, the mortgage delinquency ratio is still high. The home foreclosure ratio also shows that the number of foreclosed properties is not decreasing. However, signs of a turnaround in the housing market are emerging from a long-term standpoint. There has been a gap between the number of vacant houses and the long-term trend line, but this gap is currently narrowing (Figure 20). Figure 17: US Household real estate / nominal GDP and 10Y TN yield Figure 18: US Homebuyer affordability CI Figure 19: Ratio of US House Price to CPI Owners’ Equivalent Rent of Residence Figure 20: US LT trend of vacant housing 
When will the home ownership ratio start to climb?
The number of U.S. households increased by 1.14 million in 2011. But the number of newly constructed houses is falling: there were only 600,000 finished houses for sale in December 2011 (Figure 21). Moreover, after reaching a peak of almost 69%, the home ownership ratio fell sharply and is now 66% (Figure 22). Both the Clinton and Bush administrations enacted policies aimed at creating a society of home owners. The resulting boom in home purchases pushed the home ownership ratio up. Furthermore, sub-prime loans made home ownership accessible to low-income households. When the bubble burst, though, the home ownership ratio plunged and the balance between supply and demand broke down. Nevertheless, the tax and financial advantages of home ownership remain the same. As a result, the home ownership ratio should hit bottom at some point and start to rebound. In 1984, this ratio declined and then began to recover. There is reason to expect this to happen again in 2012. Housing market conditions differ in each region of the country. Even if the market is stagnant for the U.S. as a whole, a recovery in areas with housing shortages should lead to growth in demand from new sources (Figure 23). There is little hope for a dramatic rebound, but all the conditions for a recovery are coming together. Creating a supply-demand environment that increases the home ownership ratio is the central objective of Fed Chairman Ben Bernanke’s monetary easing. Due to the reasons that I have just outlined, the worst of the recent downturn of the U.S. economy is probably behind us. Figure 21: US New housing completed and households increase YoY Figure 22: US Home ownership ratio Figure 23: Case-Shiller Index by City 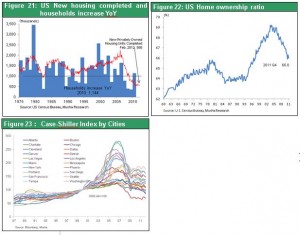
Chapter 3 The gap between interest rates and profit margins = The unprecedented risk premium
The Greenspan “conundrum” becomes the norm
A stark contrast exists between the abundance of money and profits at U.S. companies and persistently flat demand. How can we explain this contradiction? From a financial standpoint, we can point to the gap between profit margins and interest rates. Under normal conditions, the profit margins of companies should move in tandem with interest rates. For more than the past 10 years, though, profit margins have increased as interest rates steadily decreased. Naturally, the result was consistent growth in the gap between these two figures. Interest rates should rise as demand for capital increases when companies generate earnings. But instead, interest rates have remained low and there are no signs of inflation. The excess of funds at companies led to the birth of subprime loans, which created a real estate bubble that eventually burst. Even as this series of events unfolded, profit margins at companies continued to climb as interest rates decreased. The large gap between profit margins and interest rates became even greater. Figure 24 shows changes in the profit margin of U.S. companies (operating income divided by property and equipment) and interest rates (real long-term interest rate). Since the 1990s, this gap briefly narrowed following the end of the IT bubble, the end of the subprime loan bubble, the Lehman Brothers collapse and other crises. But you can see that the gap widened once again after the resolution of these crises. Figure 25 shows the same pattern in the gap between the nominal GDP growth rate and long-term interest rate (10-year Treasury). These two figures moved together until about 2000. Furthermore, the long-term interest rate was consistently higher than the nominal GDP growth rate. But since 2000, the GDP growth rate has always been much higher than the long-term interest rate. In 2005, Fed Chairman Alan Greenspan made headlines by calling this a “conundrum.” In response, the chairman used a financial approach by boosting short-term interest rates in order to prevent the emergence of a bubble and inflation. Unfortunately, there was no increase in long-term interest rates, which should have moved up along with short-term rates. Monetary tightening was unable to produce the desired result. When Lehman Brothers collapsed, profit margins plummeted and the U.S. GDP contracted. Most people thought this signaled the end of the gap between nominal GDP growth rate and long-term interest rates. Due to this view, Alan Greenspan’s prolonged monetary easing measures were believed to be the cause of the “conundrum.” The formation of a bubble was supported by the failure of long-term interest rates to move upward. However, once again we are experiencing a gap that exists because long-term interest rates are well below the nominal GDP growth rate. That means the gap between profit margins and interest rates has become a structural phenomenon. Figure 24: US Corporate rate of return and interest rate Figure 25: Trends of US GDP growth, FF rate and 10-year TN yield 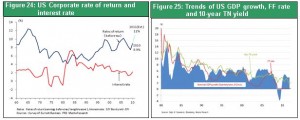
The gap between ROE and long-term interest rates
Figure 26 shows changes in the ROE and long-term interest rates. For many years, the ROE and 10-year Treasury yield moved in tandem. But since 2009, the long-term interest rate has been decreasing even as ROE increased. Obviously, this has created an even wider gap.
Two causes of excess funds ? A steep drop in the cost of investments and excessive write-offs
Alan Greenspan’s “conundrum” continued for about 10 years. No one has yet determined the cause. Obviously, the generation of large amounts of money by companies brought about the decline in interest rates. But the mechanism has not been explained. Associate Professor Kosuke Aoki of Tokyo University noted that one problem is that companies do not have enough assets to invest the funds they have accumulated (Nihon Keizai Shimbun, Economics Classroom, January 5, 2012). So excess funds resulting from a prolonged period of monetary easing is not the problem. The real problem is the lack of places to invest the funds. Associate Professor Aoki goes on to explain that the most important point is using the efficient functioning of financial markets in order to allocate funds to effective investments. My position is that the excess of cash on balance sheets is very likely the result of a dramatic drop in the cost of doing business due to globalization and the Internet revolution. Another cause is the excessive volume of write-offs by companies around the world. Companies in industrialized countries like Japan and the United States can greatly cut costs by making capital expenditures for new overseas projects and investing in sophisticated IT systems made possible by the IT revolution. As a result, the capabilities of a company’s existing facilities can be purchased again at a significantly lower cost. But since companies write off their expensive investments of the past, there is always a surplus of funds in relation to the amount needed for the new, lower-cost investments. Many people believe that the excess of funds (dramatic growth of free cash flows) (Figure 12) at companies was caused by the reluctance of executives to make new investments due to the loss of their animal spirit. However, this money is more likely linked to excessive write-offs and the decline in the cost of new capital expenditures. This is happening in all industrialized countries. Japanese companies as well are consistently generating enormous surplus free cash flows. Perhaps this gap between profit margins and interest rates will go away over a period of many years. But over the next five to 10 years, the gap will probably persist and become a defining characteristic of the global economy and financial markets. Figure 26: Comparison of ROE in Japan and U.S. during a rapid drop in interest rates 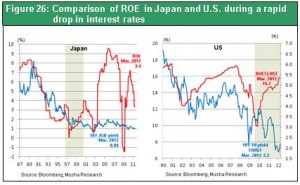
How to use excess funds for creating demand
The next question is how to achieve a recovery in jobs along with economic growth in this environment. If too much cash on corporate balance sheets is a problem, these funds must be directed to places where this capital can be used properly. Investing funds in this manner should generate new demand. Central banks and other public-sector organizations in industrialized counties must take the necessary actions. In the United States, the Fed is attempting to encourage people to take on more risk by investing these excess funds in the financial economy and real economy. In the financial economy, the strategy is to lower the risk premium by increasing the volume of investments in assets with risk. In the real economy, the aim is to encourage spending and investments with a long-term perspective rather than merely consumption to meet immediate needs. The Fed has adopted the clear strategy of using excess funds to raise stock prices, thereby using the asset effect to start a virtuous economic cycle. Japan, on the other hand, still has no clear strategy. Even as the excess of funds keeps interest rates at a record low, the Japanese government plans to improve fiscal soundness by raising taxes. Taking this action will hold down demand even more. The United States has adopted an aggressive stance aimed at creating demand. But Japan has instead chosen the timid stance of rebuilding its budget. These two differing strategies will probably also significantly influence future economic growth rates and stock market returns in the United States and Japan.
The key is selective inflation ? Productivity-growth-rate-gap inflation
Selective inflation plays a major role in the process of transforming excess cash at companies into demand. This is inflation linked to the gap in productivity growth rates. When deflation began in Japan, the country lost the means of using excess cash at companies to create demand. But the United States has maintained its demand-creation channel by sustaining a suitable level of inflation. I will discuss this point in more detail later.
Chapter 4 Using 100 years of the U.S. DJIA to view economic and stock market development ? --- Three sources of energy
Stagnation for more than 10 years and a 10-fold increase in stock prices
Let’s take a look at the history of the U.S. economy and stock market. As Figure 27 shows, from the very long perspective of the past century, U.S. stock prices have been flat for a prolonged time on only three occasions. The stock market was flat for about 10 to 15 years when the DJIA passed $100 (in about 1919), $1,000 (in about 1970) and $10,000 (in about 1999). After each of these plateaus, stock prices then surged about 10 times once prices finally started moving up again. History therefore shows that once the DJIA has stabilized at the $10,000 level over the next few years, we can expect the next step to take the average all the way to $100,000. Achieving a rally of this scale will require meeting all of the same conditions that underpinned the past two 10-fold stock market upturns. My hypothesis is presented in Figure 28. Figure 27: Dow Jones Industrial and Money Creation 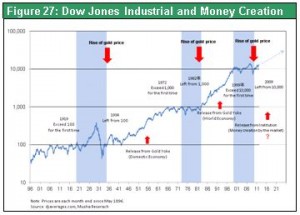
The keys are technological innovation along with the creation of a currency system
At least three factors will be needed for an economic boom that drives stock prices up by 10 times: (1) a geopolitical regime; (2) technological innovation (advances in productivity and the supply of goods); and (3) a currency system (demand creation). All three of these elements came together when the DJIA rose from $100 to $1,000. The geopolitical regime was Pax Americana (U.S. supremacy in the Western world). Technological innovation came from the petrochemical revolution (electricity, automobiles). And the currency system was the global managed currency system. When the DJIA rose from $1,000 to $10,000, the three elements were U.S. global supremacy, the information revolution and a global “paper dollar” currency system. For the next 10-fold DJIA rally, the three elements will probably be the emergence of a so-called “Global Commonwealth,” the Internet and new energy revolutions, and a market-based currency system. The technology revolutions will be the most important. However, this is a double-edged sword because the demand for labor will fall if advances in technology raise productivity. In other words, higher productivity alone will not make the economy stronger. During the Great Depression, the petrochemical revolution and increasing availability of electricity supported an enormous improvement in productivity. The ability to supply goods increased as a result. However, jobs were lost because there was not enough demand to match the amount of supply. These events demonstrate that a mechanism is needed for boosting demand at the same pace as the growth in supply and productivity. And this mechanism is a currency mechanism. Massive demand was created on a global scale as the world advanced from the gold standard to the managed currency system and then to the “paper dollar’ standard. For the next step of taking the DJIA to $100,000, two of the three conditions are largely in place: the geopolitical regime and technological progress. The remaining problem is thus the creation of a currency mechanism capable of creating the necessary level of demand. Figure 28: Long-term rise in the age of “Global Commonwealth” came into the sight 
The evolution of central banks
The role of central banks is shifting because of the ongoing change in the basis for central banks to issue currency. During the gold standard, central bank balance sheets consisted of currency and gold. In the managed currency era, central banks maintained a balance between currency and government bonds. But the crisis in Greece has cast doubts on the wisdom of holding government bonds. Prior to the Lehman Brothers collapse, government bonds accounted for almost all of the Fed’s balance sheet. After the collapse, the Fed purchased massive amounts of mortgage-backed securities and other marketable securities (Figure 29). This most likely represents an historic change in the role of central banks. We should pay close attention to the shift from gold to government bonds and then from government bonds to marketable securities. Right now, the shift may appear to be nothing more than a stopgap measure to resolve a crisis. But the shift to marketable securities may become a long-term stance. When the gold standard was discarded, the shift from gold to government bonds was at first viewed as a stopgap measure solely to achieve short-term stability. People believed that a central bank system in which currency was backed by baseless government bonds instead of gold could not last for long. Most people probably thought that the world would certainly return to gold eventually. When the Nixon shock established the “paper dollar” standard, once again people viewed this move as a stopgap measure for short-term problems. Looking back now, we can see that both of these events signaled the birth of new currency systems. This may very well be true of the changes that are now taking place. Figure 29: FRB Total assets 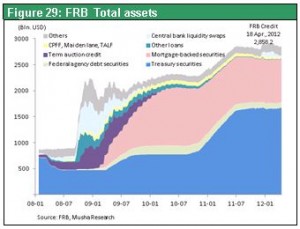 Currency systems of the past were not developed in accordance with a plan based on a particular philosophy. These systems were created because the markets demanded a change. The gold standard was supported by the widely embraced fantasy that gold has a value. Government bonds were backed by the belief that the bonds would always be repaid because governments have the authority to levy taxes. But this belief is starting to crumble. So what is the foundation for marketable securities? These securities incorporate economic value into central bank balance sheets for the first time. Marketable securities have a current value based on very predictable future cash flows. We could therefore say that these securities have a stronger backing than gold and government bonds. As you can see, a currency issuing mechanism backed by marketable securities appears to be starting to take hold. But we do not yet know if this is a new shift or simply a temporary event. Nevertheless, there is no doubt that the world needs to create new demand by adopting a new currency mechanism. Demand must keep up with the rapid increase in productivity and global growth in the supply of goods. Otherwise, there will be an increasing likelihood of a severe economic downturn caused by excess production capacity. In this respect, the United States may have started to implement an economic policy that looks ahead to the next generation. The environment for technological advances is already largely in place. If the condition of using a currency mechanism to create demand can be fulfilled, we could see the stock market start climbing toward a DJIA of $100,000.
The price of gold climbs when currency systems change
Another important point is that a surge in the price of gold has occurred each of the three times that stocks started the long-term climb to a 10-fold increase following a prolonged plateau. When the United States abandoned the gold standard in 1934, gold rose from $20 to $34 per ounce. In 1980, the gold market rally pushed the price of gold to more than $800 per ounce, four times higher than in 1979. Today we are again seeing a powerful rally in the gold market. There is a strong correlation between upturns in the U.S. monetary base as a percentage of the GDP and the gold market (Figure 30). However, the monetary base stayed low during the 1980 surge in the gold market. At that time, there was a very large increase in the money supply along with a sharp upturn in the amount of real liabilities (Figure 31). The key point here is the fact that every gold market rally has coincided with the emergence of a new currency system Figure 30: US Monetary base/nominal GDP Figure 31: US total debt growth 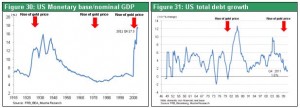
Chapter 5 Limitations on growth ? How should we view the U.S. debt problem?
The U.S. debt problem is overblown
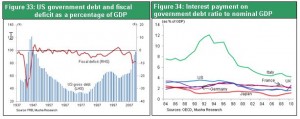
In the United States, there are still obstacles to economic growth such as the country’s excessive debt and corrections following the bursting of the bubble. But the U.S. debt problem is overstated. The real debt growth ratio coincides perfectly with the economic cycle. Figure 32 shows that the bottom of the credit cycle was also the bottom of the economic cycle. Today’s enormous credit cycle has probably almost reached the bottom. Figure 32: US Debt growth (domestic non-financial, real) 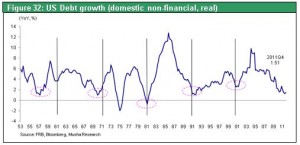 Let’s begin by looking at the federal government’s debt. Figure 33 shows that this debt was about 100% of the U.S. GDP in 2010, a level surpassed only immediately after World War II. However, as you can see in Figure 34, interest payments on this debt have declined significantly from almost 4% of GDP in the mid-1980s to almost 2% now. If economic growth and measures to control inflation keep interest rates low just as after World War II, prospects will be good for a soft landing for U.S. government debt. Figure 33: US government debt and fiscal deficit as a percentage of GDP Figure 34: Interest payment on government debt ratio to nominal GDP
A big surplus (income balance) despite being a net debtor
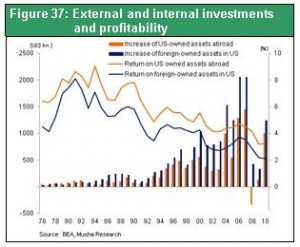
Next, let’s look at the external debt of the United States. Seven to eight years ago, the U.S current account deficit reached a peak of almost 7% of GDP. People called it the “runaway dollar” (Figure 35). Today, the cumulative current account balance is more than $8 trillion. This makes the United States the world’s largest debtor nation with net external debt of more than 60% of its GDP. Under normal circumstances, the United States should be overwhelmed by interest payments on this debt and be unable to import goods. However, the positive income balance continues to increase and climbed to an all-time high of $221 billion in 2011 (Figure 36). Figure 35: US Current account balance Figure 36: US Net income and accumulated account balance 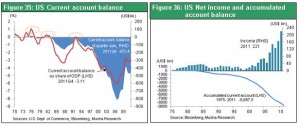 A contradiction exists in which the United States has massive debt on its balance sheet but a massive positive financial balance on its income statement. Balance sheet debt is not the most important factor that determines a company’s sustainability. The critical point is the level of expenses in relation to debt taken on to support business activities. The same is true for the fiscal balances and external payment balances of individual countries. A large volume of debt will not be a problem if a country has a substantial positive financial balance. The United States receives an enormous amount of income from overseas investments. But payments for loans, which are an internal investment, are small. The financial balance (income balance) is positive because of this gap (Figure 37). This explains why the United States has a positive financial balance even though the amount of debt is higher than the balance of outstanding loans and investments. External direct investments accumulated over many years are the largest source of income for the United States. These investments totaled $4.5 trillion at the end of 2010. Income from external direct investments was $430 billion, resulting in a high return of 9.8%. Furthermore, foreigners have made direct investments totaling $2.7 trillion in the United States that generate annual interest and dividend payments of $150 billion, which is a lower return of 5.7%. The difference between these returns translates into a U.S. income surplus. The United States is reaping the benefits of globalization. For instance, Apple, which has a higher market capitalization than any other U.S. company, manufactures most of its products overseas. Most of its employees are in other countries, too. Earnings from overseas are therefore almost entirely a return on direct investments, although Apple also receives income from licenses and patents. Income from investments like this is far higher than U.S. payments on external debt, clearly demonstrating how the country benefits from globalization. Figure 37: External and internal investments and profitability
Net assets of households are four times more than debt
Household debt is viewed as a serious problem, too. The first figure people point to is debt as a percentage of disposable income. About 50 years ago, this was only about 30%. But household debt grew to about 130% of disposable income at the peak of the bubble and is currently roughly 120% (Figure 38). However, the view that the high debt ratio will cause households to eventually become insolvent is extremely one-sided. Total U.S. household debt is currently $13.8 trillion, which is slightly less than the nominal GDP. Disposable income is approximately 70% of GDP, but the majority of household debt is loans taken out to purchase assets. Consequently, the soundness of household balance sheets differs greatly depending on two items. First is the value of the assets acquired by using debt. Second is the amount of income generated by those assets. Total assets of U.S. households are $71 trillion and net assets are $57 trillion after deducting debt of $14 trillion. Since net assets are thus four times more than debt, this level of debt should not pose any problem (Figure 39). Figure 38: Household debt as percentage of disposable income Figure 39: Household Asset, Liabilities and Net Worth 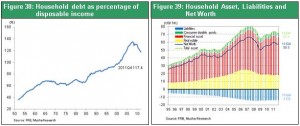 Annual income of $2.2 trillion from household assets is an enormous sum that is equal to one-third of household wage income (excluding fringe benefits) of $6.7 trillion. Household assets of $71 trillion are producing annual income of $2.2 trillion and the debt used to purchase those assets is $14 trillion (annual interest expenses on that debt is a few hundred billion dollars). Overall, there is no problem whatsoever with regard to U.S. household debt. There is definitely a growing low-income population segment that is unable to repay debt because their debt is rising as the value of their homes falls. But we can view this as a problem of a limited scale. At the same time, though, U.S. companies hold massive amounts of excess cash. Taking a close look at the U.S. debt problem therefore reveals that most of the worries about U.S. debt among many experts, journalists, investors and others are based on superficial knowledge. This is particularly true of people in Japan who worry about U.S. debt.
Chapter 6 The U.S. structure for long-term growth is sound
Progress with the international division of labor and the increasing reliance on other countries
Examining events in the past is also important for determining the medium and long-term growth potential of the United States. Since the 1970s, the hollowing out of industrial activity has defined the history of the U.S. economy. The economy has undergone a dramatic transformation as U.S. companies moved their operations to other countries. As you can see in Figure 40, both the manufacturing sector export ratio and import reliance remained approximately between 10% and 20% until the 1960s. Now, these percentages are in the range of 70% to 80%. Imports have grown to account for most of the products used in the United States. Furthermore, most of the products manufactured in the United States are exported. These figures are proof that the world has advanced to the era of the complete global division of labor. This is true in the United States as well as in Japan. Employment statistics for individual industries (Figure 41) shows that the U.S. workforce has increased in the education, health care, specialized services, tourism and entertainment, and some other sectors. Jobs have shifted from manufacturing to positions associated with internal demand. Manufacturing has steadily declined for many years as a percentage of the GDP, too. At the same time, non-manufacturing sectors like finance, real estate, education and health care have accounted for a rising share of the GDP. All these shifts attest to the shift that has occurred in the composition of U.S. industry. Particularly noteworthy is the decline in jobs in the IT sector, which should be a growing industry. Higher productivity backed by technological innovation and the shift of jobs to other countries are most likely the causes of this decline. Figure 40: US Export ratio and Import dependency ratio Figure 41: US Employees by industry (1995Q1=100) 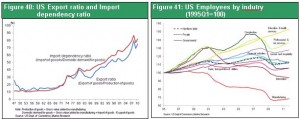
The structural shift in employment as the share of low-productivity, internal-demand jobs increase
A shift in the structure of the division of labor also signifies a change in the structure of the economy. This in turn leads to changes in life styles and consumption and a change in the structure of employment. Figure 42 shows the change in the number of manufacturing and non-manufacturing jobs since 1980. The two categories are clearly moving in opposite directions. Manufacturing jobs have been decreasing steadily as the global division of labor hollowed out the U.S. industrial sector. At the same time, the number of non-manufacturing jobs has been rising year after year. In Japan, there was a steep drop in manufacturing jobs in the 1990s after the bubble burst. However, the number of non-manufacturing jobs started falling in the mid-1990s. This disparity spotlights the gap between the United States, which adapted to globalization by altering the structure of domestic industries, and Japan, which has not responded to globalization as quickly. Figure 42: US and Japan Numbers of workers by manufacturing and non-manufacturing sector 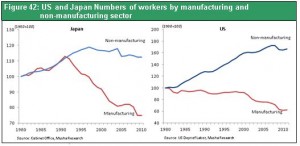
The increase in the consumption ratio is not bad news
Another significant change involving the structure of the economy is the rising consumption ratio (Figure 43). Private-sector consumption remained at about 60% of the GDP since World War II. But after 2000, this ratio climbed to more than 70%. A higher consumption ratio immediately causes the investment ratio to fall. This is why the United States was the target of intense criticism as a country that focuses solely on consumption while overlooking investments. But a closer look reveals that this view is not accurate. Globalization has brought down the amount of capital expenditures for factories and other projects within the United States. But there has been an increase in intellectual investments, such as the use of people to create software. These investments have produced a new generation of intellectual industries and companies. Examples include Apple, Google and Facebook. The problem is that almost no expenditures for intellectual assets are recognized as investments by accounting rules or when calculating national income. For accounting purposes, investments are capitalized in order to defer the recognition of expenses. Intellectual expenditures that can be capitalized are restricted to software and only a few other items. Most of these expenditures are therefore treated as expenses when determining a nation’s economic statistics. As a result, the amount of expenditures treated as expenses becomes higher as the ratio of investments in education, technology development, software and other knowledge-intensive activities grows. Investments involving people do not remain as assets on financial statements. But these invisible intellectual assets are extremely valuable as an element of a nation’s economy. Figure 43: US Private consumption expenditure as a percentage of GDP Figure 44: US investment on IT 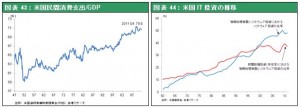 Figure 44 shows the amount of IT investments that are included in the GDP. Data devices and software held steady at between 10% and 20% of private-sector capital expenditures (non-housing) until the early 1980s. This figure is now almost 40%, showing that IT-related capital expenditures have grown to a massive scale in the United States. Furthermore, software has increased from almost nothing prior to 1960 to about 50% of IT-related capital expenditures. As I explained earlier, software purchased from external suppliers can be recorded as assets. But software for internal use is treated as consumption and must be recorded as an expense. In today’s information-dependent society, there is still no tool for accurately measuring assets that have been accumulated intellectually. Consequently, in industrialized countries, the share of hardware investments is decreasing while the share of expenditures for software (intellectual assets) is increasing. Obviously, the shifts in these two shares are raising the percentage of IT-related investments that are treated as expenses for accounting purposes. However, this is not necessarily harmful. An enormous structural change is taking place owing to globalization, the hollowing out of industry, increasing use of software and other events. The United States has retained the intellectual portion of activities and moved the physical portion of labor overseas. Structural change has raised the export and import ratios, altered the positioning of manufacturing, boosted the consumption ratio, and triggered other events. All these changes do not mean that the United States is becoming weaker. We should view these events instead as the result of the United States enlarging the scope of its economic activities to a global scale. Compared with Japan and even China, which has a rapidly growing economy, the U.S. is still an economic superpower with a much higher level of vitality. Furthermore, the United States is in no danger at all of losing this position of superiority.
The causes of the income gap and the proper response
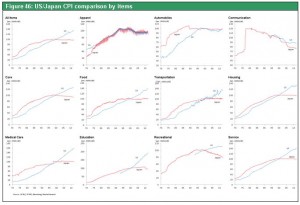
The widening U.S. income gap is a source of concern. Figure 45 shows income grouped by education level. Incomes of people with advanced education such as college degrees and professional school qualifications have been climbing steadily. The difference between this group and people with a high school diploma or less is growing. Globalization is once again the cause. Wages for unskilled labor are subject to downward pressure from competition with low-wage workers overseas and the migration of jobs to other countries. In contrast, there is upward pressure on wages for intellectual work because there are no competitors in the global division of labor. A widening income gap is the obvious result. One way to narrow the income gap is to raise taxes for people with high incomes, boost the minimum wage, provide financial assistance to people with low incomes, and use other similar measures. However, taking these actions will prevent a country from competing successfully with other countries. The proper course of action is to educate low wage earners so they can join the skilled labor force. I believe this is the only way to narrow the income gap. Paying the same wages for the same work is becoming an increasingly important element of the international labor market. In this environment, it would be very difficult to make a discretionary reallocation of income from high to low-income workers. This is a reality that workers are forced to recognize and accept. In this sense, the U.S. economy is coldhearted and extremely efficient. Advancing globalization is making workforces in the United States even more streamlined. This explains why the United States is able to execute the process of creative destruction at a very high speed. Figure 45: US Income by educational attainment 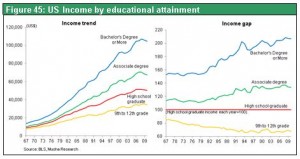 The next subject is how to allocate resources to industries that are vital to the lives of a country’s residents even though productivity increasing slowly. Accomplishing this requires inflation that can offset a country’s inferior productivity growth rate. Productivity is highest in the manufacturing sector but downward pressure on wages is also the greatest in this sector. In addition, the number of jobs is falling in this sector. In the non-manufacturing sector, though, productivity that is not very high has been responsible for steady increases in the unit labor cost and the number of jobs. The comparison of prices in the United States and Japan shown in Figure 46 sheds more light on this subject. Japan is experiencing long-term deflation while prices continue to climb in the United States. Looking at individual sectors reveals that prices for apparel, automobiles and communication services are falling at almost the same rate in the United States and Japan. Just as in Japan, the benefits of globalization and technological innovation are bringing down the cost of many items. In other words, globalization and the IT revolution are not the reasons for Japan’s prolonged deflation. Differences between prices in Japan and the United States are in categories associated with domestic demand and where productivity is not rising quickly. Examples include food, transportation, housing, health care, education, culture and recreation, and services. Why is inflation occurring in U.S. industries linked to internal demand? The reason is that the U.S. has a mechanism for raising the wages of workers in sectors with flat productivity at the same rate as the wages of workers in sectors with rising productivity. About 40 years ago, there was a debate in Japan about “productivity improvement rate gap inflation.” To raise wages at the same rate across different industries, there must be inflation that allows increasing wages in industries with a low productivity growth rate. The debate also focused on what happens if inflation becomes high in low-productivity sectors. Many industries that are vital to day-to-day living do not have a high productivity improvement rate. Selective inflation is thus vital to maintaining a sufficient number of jobs in these vital industries so that consumers can receive essential services. Inflation rather than higher taxes is what is needed to allocate more income to sectors where productivity is increasing slowly. This is the best mechanism for income allocation. In the United States, wage inflation is occurring in sectors with no productivity growth. The result is even more and better education, entertainment, health care and other services that further enrich the lives of consumers. In Japan, prices in the service sector have moved in the opposite direction. Lower prices have brought down wages for service-sector workers and reduced the quality of the service sector. These declines have probably reduced the standard of living for the people of Japan as well. To summarize the points I have discussed, the United States has utilized globalization, the IT revolution and rising productivity to further increase personal income. Furthermore, the United States has a channel for allocating the benefits of higher income because of reforms to the U.S. industrial structure and workforce structure along with a suitable level of inflation. The United States is complacent about the adjustments that followed excesses like the subprime loan problem. Nevertheless, I believe there is absolutely no need to have any doubt about the ability of the U.S. economy to achieve a transformation or about the economy’s long-term growth potential. Figure 46: US/Japan CPI comparison by items