Jul 25, 2014
Key Strategy Issues Vol.K297
The US economy’s cyclical recovery gains strength - contrary to the widespread structural pessimism
The Fed’s persuasive explanation of the effectiveness of QE
(1) Fears of high prices themselves are proof that this market is still young
Widespread warnings and the fear of high prices
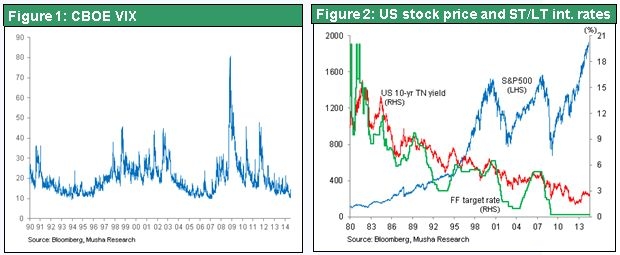
U.S. stock prices continue to climb to new highs amid a big drop in bond yields. Risk-taking sentiment is becoming stronger. The volatility index (VIX) has fallen to a record low, indicating that this is the perfect environment for investments. An M&A boom of unprecedented magnitude is emerging that is fueled by surplus capital at companies and low interest rates. Investments banks like Morgan Stanley and Goldman Sachs are reporting strong earnings. Despite all this good news, market participants are extremely wary. Many people foresee a black swan that will have a negative impact on the economy and financial markets. There is no shortage of bad news: geopolitical instability, economic instability in emerging markets, and especially China, and concerns about the exit from quantitative easing. But thus far, these events are having no effect.
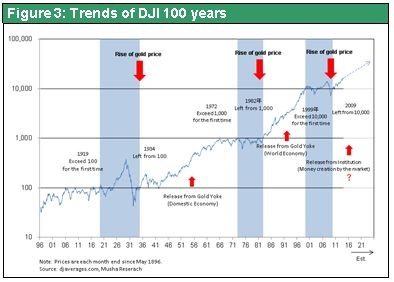
It is too soon to become pessimistic. Or maybe I should say that pessimists are way off target. As you can see in Figure 1, VIX has declined to a level that is below even the recent lows of 1995-96 and 2005-06. Both of the previous two lows were the start of bull markets. The peak and subsequent steep drop in stock prices occurred three to five years after these volatility lows. A record-low VIX is not a warning sign. Instead, investors should view this as a sign that a bull market has started. U.S. stock prices have been climbing steadily for five years since March 2009, as Figure 2 shows. Furthermore, stock prices have been rising with no correction at all since QE3 started in September 2012. No wonder investors are becoming afraid of the heights of stock prices. Figure 3 tracks the Dow Jones Industrial Average over the past 110 years on a logarithmic scale. As is clear from the gradient that shows the growth rate, the current rally is not at all extreme in comparison with past bull markets. Consequently, the unusually strong mood of wariness among investors itself is an indication that this stock market rally is still young.
(2) Worries about secular stagnation
The eruption of the economic structural view that is regarded as a reason for pessimism
Pessimistic economic views that attempt to justify the fear of high prices are persistently part of economic debates. In Capital in the 21st Century, Thomas Piketty states that a widening wealth gap is inevitable with capitalism. Secular Stagnation by Lawrence Summers has a similar view. However, both books have been used as reasons for justifying pessimism, which is not the intent of the authors. While I recognize that there are problems with the structural views of these books, I believe the books present arguments that are proper and meaningful. I agree with the views of the two authors that there is currently a “wealth gap” and “insufficient demand.” But these characteristics themselves are creating the conditions for a stock market rally. If there is an unprecedented stock market rally a few years from now, it would be followed by an unimaginable future. Both the formation and destruction of a bubble and massive prosperity are possible. There is no doubt that government policies will determine our fate. In any case, there is a high probability that stock prices will continue to move upward.
Can the post-Lehman shock growth rate distortion be corrected?
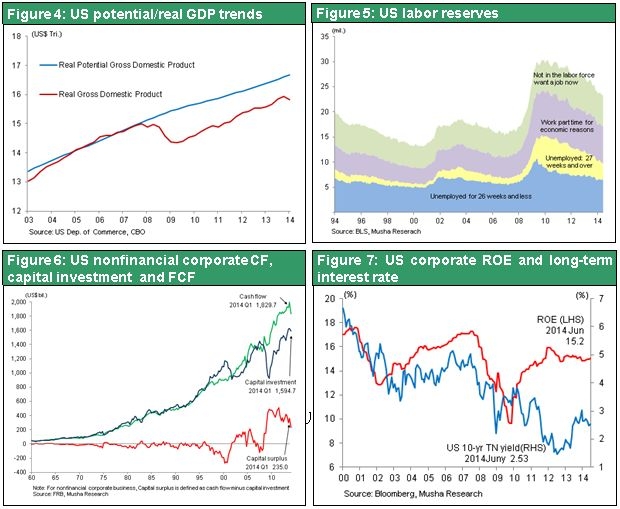
Since the collapse of Lehman Brothers, the U.S. economy has consistently expanded at a rate that is below its prior growth trajectory, as Figure 4 shows. Slow growth has occurred against a backdrop of enormous surpluses of labor and capital (see Figure 5, broad-sense unemployed = labor reserves). What is the cause? Opinions differ depending on how serious one believes this problem is. Views of the downward distortion of the growth rate can be divided into the following four categories.
1) The view that financial policies can end the distortion
2) The view that non-financial policies (fiscal policy, tax revisions, institutional reforms) can end the distortion
3) The view that this is a structural problem that cannot be ended for the time being
4) The view that this distortion is now the fate of the US economy and can never be resolved
Embracing either view 1 or 2 gives us reason to adopt a positive outlook because proper policies can produce full employment and strong economic growth. If we believe view 3, financial markets will remain unsettled for the foreseeable future. But view 4 supports the outlook for another economic and financial crisis no matter what happens. Mr. Summers states that it is impossible to eliminate the growth distortion with financial policies alone. However, he supports the second view because he believes that secular stagnation can be terminated by encouraging private-sector investments with fiscal policy, tax system reforms, deregulation and other initiatives. Therefore, this is not a stance that belongs with stock market pessimists.
The structural stance problems of “insufficient demand” and the “wealth gap” are legitimate concerns
Mr. Piketty states that in a capitalist economy, a return on capital that is higher than economic growth results in a widening wealth gap. There are always many doubts about whether or not this view is correct. But this is precisely what is happening now in the US economy. Excess money that companies and wealthy individuals cannot use has accumulated. Capital has thus not fueled a virtuous cycle of demand creation. Figure 6 shows free cash flows at US companies and the consistent surplus of cash since 2000. Figure 7 compares the return on equity, an indicator of corporate profitability, with a major long-term interest rate (10-year US Treasury note). You can see that the gap between these two figures widened significantly after the financial crisis started. Companies are generating strong earnings, but there was inadequate growth in investments and consumption demand. The obvious result was the inability to stimulate demand for capital, which produced consistently low interest rates.
Apparently, Mr. Piketty is somewhere around view 2 or 3. He thinks that, over the long term, the current situation can be corrected through income redistribution that uses the progressive taxation of capital. However, over the short term, the view of Mr. Piketty can be regarded as nothing but a reason for stocks to go higher. The reason is that the reality he sees, which is the co-existence of surplus capital and strong earnings, is producing high returns on investments while holding down the cost of investments.
(3) The Fed’s persuasive explanation of the effectiveness of financial measures
QE - A new financial measure that works from the supply side
The Fed (Chair Janet Yellen) supports the first view, which is that financial policies can end the distortion. Quantitative easing has consistently been very effective as a treatment for the distortion, even if it is not possible to determine the cause of the problem. Even now, the situation continues to improve. The Fed’s recent stance is that the financial crisis, which created a demand-side shock, has a historical effect on the supply side that reduced the potential economic growth rate. In other words, the financial crisis and rapid contraction of demand dealt a severe blow to the supply side. The primary causes were a drop in capital expenditures, a downturn in productivity, the loss of the desire of people to look for jobs, and an increase in the natural unemployment rate. Consequently, the Fed’s position is that even though financial policies are normally associated with demand, these policies can now be expected to increase supply, which in turn pushes up the potential economic growth rate.
The economic upturn is young; the cyclical recovery can end the surplus of money and workers
Analyzing the current condition of the US economy shows that the Fed’s position is persuasive. As you can see below, the US cyclical recovery has been extremely slow because of the after-effects of the financial crisis. Under normal circumstances, no economic recovery could take place. In baseball terms, the economic cycle is still only in the fourth or fifth inning. There is still clearly ample room for this cycle to continue until the ninth inning is reached for the following reasons.
1) There is enormous unfulfilled latent demand regarding housing investments and capital expenditures.
2) Growth in wages is starting to accelerate, which will push up household incomes. This positive cycle is just now beginning. Furthermore, the steady growth in jobs will raise household incomes.
3) The age of this economic upturn is very young with respect to the credit cycle, too.
Even without the government intervention and dramatic innovation of Mr. Summers’ position, the US economy is at a point where there is sufficient potential for economic expansion from pent-up demand alone.
(4) The economic cycle is still young ? Much upside potential for housing investments, capital expenditures and labor income (jobs + wages)
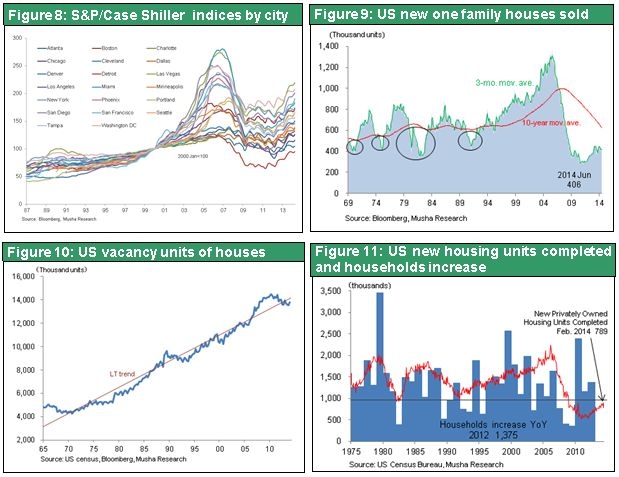
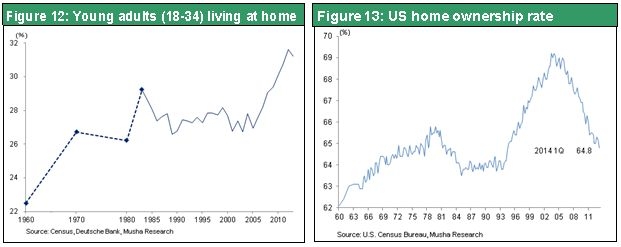
Upside potential for housing demand
Since 2011, prices of houses have stopped falling and started to recover (Figure 8). Despite this upturn, new housing construction activity is extremely slow (Figure 9). This shortage of new supply is greatly improving the balance between supply and demand for existing houses. Numerous statistics indicate that significant demand for new houses has accumulated. (1) The decline in residential vacancies is below the long-term trend (Figure 10). (2) The supply of new housing is consistently below the increase in the number of households (Figure 11). (3) There is an increase in the percentage of young people (ages 18 to 34) living with their parents (Figure 12). (4) The home ownership ratio has fallen sharply, which is a sign of growth in potential demand for houses (Figure 13).
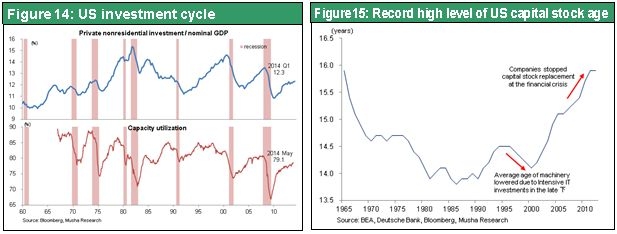
Room for upside in capital expenditure too
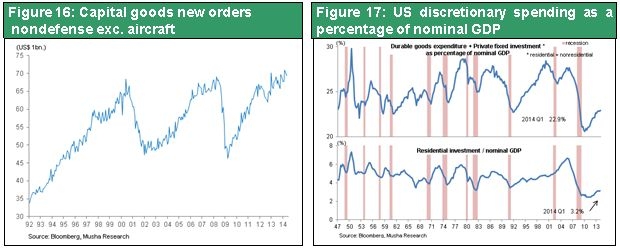
Although the weighting of capital expenditure in GDP is recovering, it remains at a comparatively low level from a historical perspective. That said, demand factors are piling up: (1) the capacity utilization rate is recovering (Fig 14); (2) mounting obsolescence in the capital stock is resulting in growth in renewal and replacement demand (Fig 15); and (3) the return of manufacturing industry to Japan (employment in manufacturing industry, which had been in a long-term decline, started to rise in 2011) has been evident, amongst other factors. Moreover, orders for non-defense capital goods (excluding aircraft), a leading indicator for capital expenditure, have already exceeded the previous all-time high (Fig 16).
Fig 17 shows the US economic cycle and the ratio of discretionary spending to GDP, which moves in tandem with it. Because discretionary spending (spending on durable goods + residential investment + private sector capital investment) is non-essential and non-urgent, it is tightly constrained when the economic environment deteriorates or when the outlook for future prospects is challenging, but conversely expands rapidly in more positive economic circumstances in such a way as to create a wave in the economic cycle. This discretionary spending to GDP ratio slumped to a postwar low in the wake of the Lehman Shock, ushering in the deepest recession seen since the Second World War. Although this is now starting to recover, it is evident that it remains at the bottom level for past economic conditions. The ratio of residential investment to GDP has plummeted and remains conspicuously low and the after-effects of the bursting of the housing bubble are looking serious. Consequently, although discretionary spending has just arrived at the beginning of a long awaited recovery at last, it is fair to say that there is still plenty of room left for a cyclical recovery.
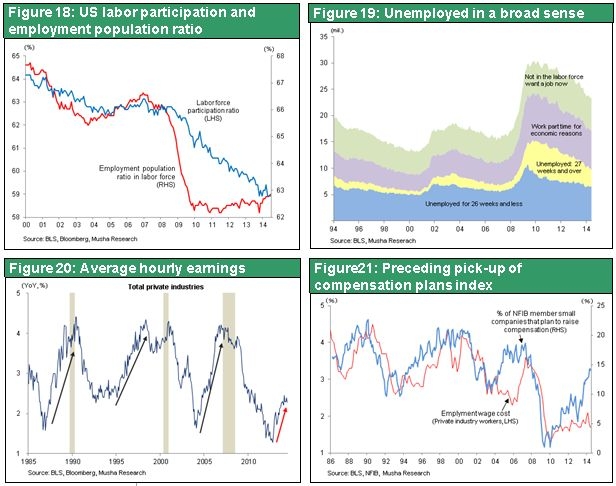
Plenty of room for major improvements in employment and wages → leading to an acceleration in household incomes
Let’s look next at the process by which growth in employment and rising wages raise household incomes. Although the unemployment rate has fallen from the post-Lehman-Shock peak of 10.2% to 6.1% by June 2014, the recovery in employment remains sluggish. The improvement in the unemployment rate has been mainly due to a decline in the number of persons looking for jobs, and so the employed population rate remains low (Fig 18). Fig 19 illustrates that although the estimate for those persons that can be defined as being unemployed in a broader sense is gradually decreasing, it is clear that the level is far from that seen in past periods of positive economic activity. The ‘slack’ that the FRB is focusing on remains extremely large. Moreover it is evident that wages are only just starting to rise at last (Fig 20). That said, data released by the NFIB (the National Federation of Independent Business), which is said to be a leading indicator on wages, shows that the proportion of company planning to raise pay has been increasing strongly since the start of 2014, and indicates that the rate of pay increases will continue to accelerate from this point on (Fig 21). It is reasonable to say that the rise in households’ working income is continuing to gather momentum as a result of the current steady increase in employment and the acceleration in the pace of pay rises.
(5) Conversion of income distribution and corporate surpluses declining
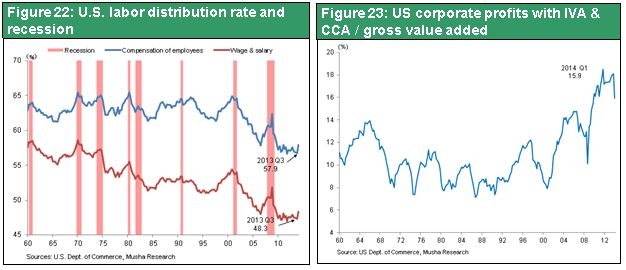
Long-term declining trend in labor’s share of income reaching watershed
The acceleration in household’s working incomes is bringing about a change in the distribution structure for the incomes of the population of Japan and is likely to be providing a further boost to consumption and residential investment. Fig 22 shows that the trend of labor’s share of income and the economic cycle are in step in the US, with labor’s share of income declining in the first half of economic expansion, and rising from the midpoint towards the peak of economic activity with evident regularity. Moreover, with the long-term declining trend in labor’s share of income that has continued from 2000 to the present almost coming to an end at present, it is possible to assume that we are now in a phase in which it will start to rise at last. Surely, this must be related (see Fig 23) to the lowering of a corporate income/national population income ratio that has become so large.
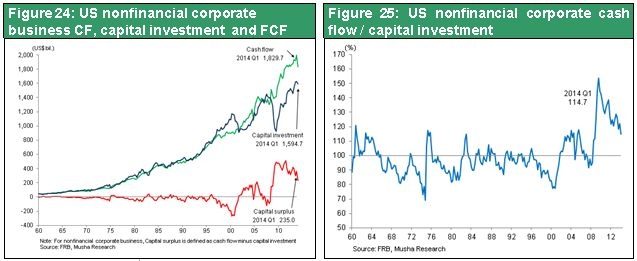
Gigantic corporate funds surplus starting to decrease
The rise in the labor’s share of income and the resulting decline in cash flow, will mean companies running down the conspicuously huge capital surpluses that they have accumulated. Figs 24 and 25 show the trends in US corporate sector cash flows and capital investment, and free cash flows. From 2000 onwards the labor’s share of income has been declining virtually in tandem with this trend which illustrates the remarkable extent to which huge capital surpluses have been ballooning in the corporate sector. The excess profits generated by the IT net revolution and globalization resulted in capital surpluses that companies had no way of utilizing effectively. This surplus capital has the same roots as the surplus labor and combined to become the cause of the formation (and later bursting) of the bubble in the US economy from around 2000 onwards and thus contributed to the chaos it wreaked. Moreover, this phenomenon also became the key factor in expanding the disparity that Mr. Piketty has been stressing and focusing on. That said, this capital surplus in the corporate sector is now clearly beginning to show a clear shift into a declining trend.
From this point on, the corporate capital surplus is expected to start to shrink rapidly as a result of: (1) rising capital expenditure; (2) increases in share buybacks and dividend payouts; (3) M&A activity soaring to an entirely unprecedented new level. This means that the slack that has accumulated and is currently lying idle will be put to effective use as it circulates around the economic cycle. It is fair to say that the prospects for the gradual disappearance of the lack of demand in the US economy continue to look brighter and brighter by the day.
Virtuous credit environment, credit cycle also young, bubble concerns no longer apply
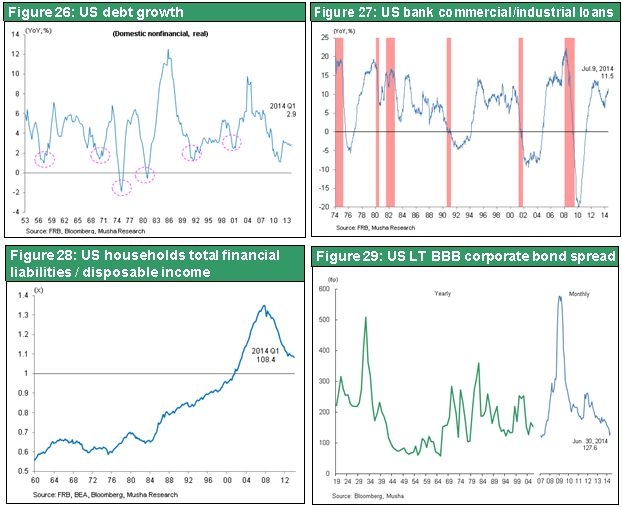
It’s fair to say that, even from the credit cycle perspective, the current economic phase is in the first stages of the cycle. That is to say, leverage remains heavily squeezed but there is absolutely no concern about the feared bubble or worries about rising credit instability. Fig 26 illustrates how credit cycles (real liability growth rates) regulate long-term economic trends and it is evident that this clearly entered a bottoming-out phase in 2011. Household debt as a proportion of disposable income is falling sharply and corporate liabilities as a proportion of GDP is not rising either. Fig 27 shows the trend in lending to US businesses clearly in the first stage of recovery after having fallen heavily. As FRB Chair Janet Yellen explains: (1) overall debt has been squeezed; (2) interest rates have fallen; (3) corporate earnings are increasing; & (4) asset prices are rising. In other words, because the debt/capital ratio has fallen sharply, the earnings before payment of interest/interest ratio (the capacity to pay liabilities held = interest coverage) has soared and it is reasonable to claim that credit risk has greatly decreased as a direct result. Credit risk premiums (the likelihood of corporate failure built into/discounted in the credit markets) soared to a historical high in the immediate aftermath of the Lehman Shock and so it is entirely natural, given the current credit environment, that this has now fallen to a historical low (Fig 29).
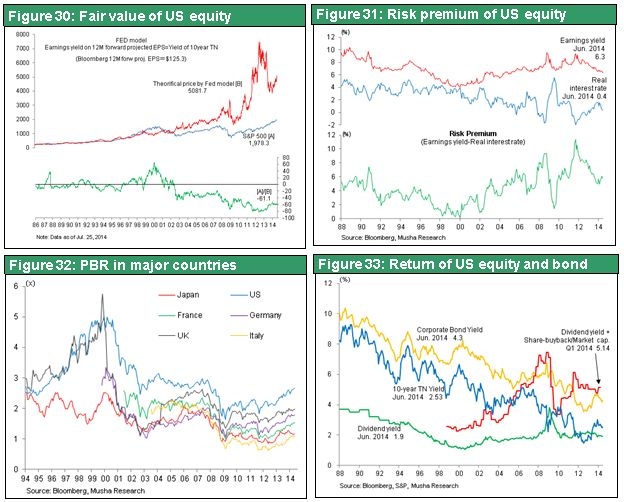
Critical comment to the effect that there is a share price bubble is also wide of the mark. Fair value for equities deriving from unprecedented corporate earnings and normalization from ultra-low interest rates can be calculated, by reference to the Fed Model (forecast equity returns = yield on 10-year Treasuries), at 5,081 points for the S&P 500 index. This means that there is currently a 61% discount to fair value. Applying PBR, the most solid and basic yardstick for evaluating share price value, shows that US equities, despite having fallen from their IT bubble peak of 5x to below 3x, are still the most highly valued of any major nation. That said, given the high ROEs of US companies, such a valuation cannot be said to be excessive. This is because, as Fig 33 shows, the dividend yield of 1.9% and share buybacks of 3.2% add up to a huge 5.1% shareholder return on the total market capitalization of the index and equates to a very high return that is equivalent to double the yield of long term Treasuries. It must be reasonable to assert therefore that US companies, judged on the basis of solid value creation, must be considered as possessing ample equity value.
Given the above, it seems fair to say that there will be no change to the rising trend in US equity prices over the course of the next few years. A positive attitude towards risk taking therefore looks advisable.