Nov 01, 2017
Strategy Bulletin Vol.189
The White Black Swan Takes Off
- A big correction of Japan’s abnormal pessimism has started
Up for 16 days straight for the first time ever – A white black swan
Black swans are events that occur even though they were considered to be impossible. They are normally downside events. But black swans can also be upside occurrences that no one had foreseen. One month ago, no one (including me) imagined that the Nikkei Average was about to set a new record by moving up for 16 consecutive days. This didn’t happen even during Japan’s fast-growth postwar days. Furthermore, a Wall Street Journal article on October 24 stated that “the 15 days of consecutive gains appear to be one of the longest streaks on record of any market.” I believe we can call this record-setting upturn a white black swan because it is the ultimate unexpected positive surprise. Stock prices can be regarded as the most accurate way to gauge the health of the economy in the near future. If so, then no one can deny that the stock market’s white black swan may be a precursor of an unexpected upturn of Japan’s economy in 2018.
Most people have no faith in this historic rally
I received a phone call from a veteran trader. He was surprised because other traders as well as his customers were not impressed at all even after this historic event had taken place. Everyone is still skeptical. He wanted to know my reaction. Media reports were full of confident talk about doubts and warnings that overheated stocks will create a bubble. No one is willing to face this historic rally head on. My position is that this response is further proof that this event is a white black swan. Many market observers have concluded that this rally was simply a fabrication. For instance, the Mainichi Shimbun published its viewpoint on October 24 with the headline “Is this cockiness of the stock market and Bank of Japan?” In its November 7 issue, Shukan Economist, a magazine affiliated with Mainichi Shimbun, had a special section titled “The Dangerous Global Bubble.” Media companies have adopted the stance that this upturn in stock prices is a mistake and something that should be viewed as evil. Really?
Rarely do we see a favorable investment climate on this scale as so many positive factors converge: geopolitical events; worldwide economic growth; the technology revolution; record-high earnings at Japanese companies backed by powerful business models; abnormally low valuations of Japanese stocks; market-friendly government policies; and widespread skepticism and pessimism. Musha Research has made this point repeatedly since the beginning of 2017. For example, the June 29 Strategy Bulletin 183 titled “There is no reason not to buy Japanese stocks” examined this investment climate at length. But Musha Research is still part of a very small minority of optimists even though the stock market is finally starting to factor in all the positive factors. I believe Japan has reached a stage that people will look back on as a key inflection point for the growth of assets.
Upside and downside bubbles have had an impact on Japanese stocks
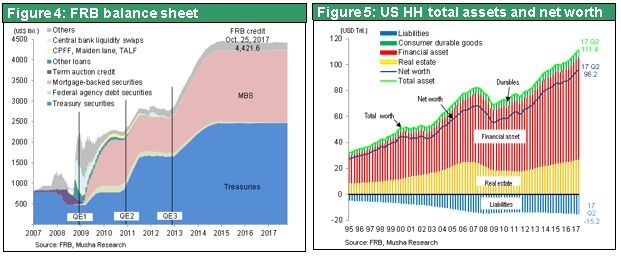
In 1990, Japanese stocks were mispriced to the point that their prices were far above the true value. At that time, the earning yield was below 2% (equating to a PER of more than 50), the dividend yield was 0.5% but the long-term government bond and bank deposit yield was 8%. The disparity was obvious. Today, we are again witnessing a dramatic mispricing of Japanese stocks. But this time, prices are far below the true value. The earning yield is 7% (PER of 15) and the dividend yield is 2%. In comparison, long-term government bonds and bank deposits are yielding nothing. Both of these obvious “mistakes” (one an upside bubble, the other a downside bubble) must be corrected at some point.
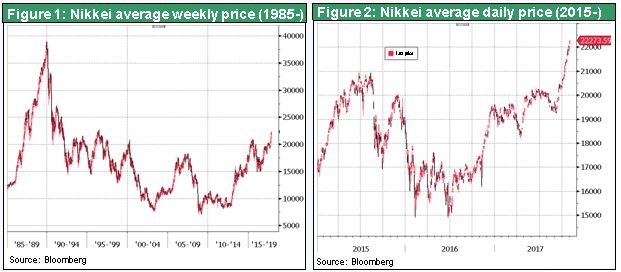
The mismatching of the upside bubble of 1990 was corrected by the subsequent plunge in stock prices. Now we are probably seeing the start of a correction of the current enormous downside bubble. This could very well be the beginning of a long and powerful rally that propels the Nikkei Average to ¥24,000 to ¥25,000 by the end of this year, ¥30,000 by the end of 2018 and ¥40,000 by 2020. In 2013, immediately after the emergence of Abenomics, when the Nikkei Average was only about ¥10,000, I authored a book titled “A Once in a Century Wave Has Come to Japanese Stock Market” (Chukei Publishing). Since then, I have consistently stated that the Nikkei Average is headed for ¥40,000. Now I think ¥40,000 will be merely a milestone on the way to even higher levels.
A momentous shift in the economic outlook – Feedback to the real economy from reflexivity and asset prices
Understanding this very positive market outlook requires an enormous shift in how people perceive economics. People who passively watch stock prices climb think that a dog wags its tail. In other words, they believe that everything originates from the real economy and stock prices are nothing more than a mirror of the real economy. But sometimes the tail wags the dog because stock prices can alter the real economy. This is the reflexivity theory backed by George Soros. Normally, asset prices and financial markets are a reflection of the real economy. However, at times the feedback from these prices and markets influences the real economy. Looking back at the story before and after the global financial crisis, the real economy was clearly receiving constant feedback from asset prices. First, an excessive increase in asset prices (upside bubble) produced excessive demand that impacted the real economy. Next was a drop in asset prices (a downside bubble) that went far below fair value. Plunging asset prices dealt a devastating blow to the real economy. This is obviously a situation where the real economy was moved by asset prices.
Quantitative easing is an example of the reflexivity theory at work
There is more than this to the reflexivity theory. In response to the global financial crisis, the major countries of the world all embarked on quantitative easing. The goal was to move the real economy by using central banks to control asset prices. This process used the following transmission mechanism: central banks bought assets, which made their balance sheets expand ➡ central banks lowered long-term interest rates (which pushed up prices of bonds) ➡ prices of stocks and real estate moved up ➡ the financial soundness of financial institutions, companies and households improved ➡ the result was growth in investments and consumption (the promotion of risk-taking) ➡ increasing expectations for inflation.
Figure 5 shows the significant improvement in the financial position of US households resulting from the successful use of quantitative easing. Net assets (total assets minus liabilities) of households were $68.2 trillion in the second quarter of 2007, which was shortly before the outbreak of the global financial crisis. By the beginning of 2009, which was not long after the start of this crisis, net assets had plummeted to $55.1 trillion. Household net assets then recovered because of a rapid upturn in stock prices (stock prices are now three times higher than the global financial crisis bottom) and a recovery in housing prices to the level prior to the bursting of the real estate bubble. In the second quarter of 2017, US household net assets were $96.2 trillion. Net household assets peaked at 6.5 times of disposable income immediately prior to the global financial crisis. This multiple then fell to 5.1 times and is now 6.7 times. There is no doubt that this huge wealth effect has been the driving force behind the recovery of the US economy.
Quantitative easing was initially regarded as an absurd policy that was equivalent to the tail wagging the dog. However, the global economy would probably have continued to decline with catastrophic consequences without the use of quantitative easing to prevent asset prices from remaining too low.
Asset prices are starting to provide feedback in Japan
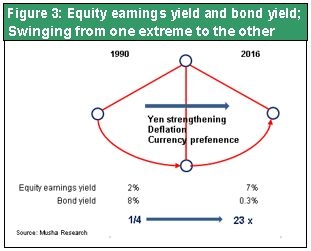
Japan is probably still in a stage in which the tail is wagging the dog. Stock prices are at last rising to new highs following the collapse of the asset bubble. The Nikkei Average is now above ¥21,000 which it couldn’t exceed for a long time. The average has set a record of 16 straight increases and chartists are beginning to believe that stock prices have technically advanced to a new dimension. If the Nikkei Average of ¥30,000 or ¥40,000 which chartists draw really comes in sight, what should economists do?
The forecasts by major think tanks for Japan’s real economic growth between now and 2020 all call for average annual growth of about 1%. Although forecasts say nothing about stock prices, these forecasts do not anticipate a big change in stock prices. In other words, forecasts are based on the premise that there will be no correction in the downside bubble. These forecasts would be very different if these think tanks thought the Nikkei Average could climb to ¥40,000.
If the Nikkei Average reaches ¥40,000, Japan’s stock market capitalization would double from the current ¥600 trillion to ¥1,200 trillion. That would be an increase of ¥5 million in assets for everyone in Japan. The resulting wealth effect would certainly spark growth in investments and consumer spending. The wealth effect and stronger corporate and household balance sheets would produce an enormous increase in the risk-taking capacity of Japanese companies, households, investors and financial institutions. A dramatic change would take place in Japan’s economic landscape.
Japan can probably easily end deflation and boost nominal GDP to ¥600 trillion if we use an outlook based on the premise that the Nikkei Average will reach ¥40,000 in 2020. This is why I want economists to create economic forecast models by using autonomous variables instead of dependent variables for stock prices. Even if there is no change in earnings and dividends, the earning yield would be 3% to 4% and the dividend yield would be almost 1% if the Nikkei Average climbs to ¥40,000. These are still attractive returns in relation to the absence of any return on government bonds and bank deposits. At ¥40,000, the PBR of Japanese stocks would rise from the current 1.3 to 2.6, which is still below the PBR of 3 in the United States. Consequently, It would be OK to say that ¥40,000 level of Nikkei would be within the range of fair valuation.
Childish criticism of government asset buying is becoming increasingly widespread
Some people are critical of measures to push up asset prices. They call the higher prices resulting from this spending a bubble made by the government. For example, Jitsuro Terashima made a number of critical remarks in the Shukan Economist mentioned above. He said the Nikkei Average would be less than ¥12,000 without purchases by the Government Pension Investment Fund and Bank of Japan and that the Japanese government is artificially creating high stock prices. Mr. Terashima also says there is a need to control the distorted financial capitalism that the government has created. This could be called a government-made bubble if public-sector purchases to push up prices had taken place without growth in corporate earnings (which determine the value of stocks). But if prices are backed by earnings, then criticism is groundless because the government is instead taking the lead in correcting the downside bubble. This is exactly what the Fed’s quantitative easing accomplished in the United States. Therefore, statements like this are childish criticism that has no basis in the quantitative easing success stories in other countries.