Nov 06, 2018
Strategy Bulletin Vol.212
Ichioka vs. Musha - Where is risk now and how serious are risk factors?
- A brief correction rather than a bear market is an excellent buying opportunity
(1) An unprecedented stock market drop
Sakurai (Musha Research staff): Stock prices have fallen sharply twice this year, once in February and once in October. Since the beginning of October, US stock prices are down 10% and Japanese stock prices are down 14%. Today we will talk about how to interpret these downturns. Our guest is Shigeo Ichioka. Mr. Ichioka has 30 years of experience in the investment sector, having spent time in fund management and equity research at trust bank, life insurance and other firms. He is currently performing financial market research on an independent basis. Let’s start our discussion by Mr. Ichioka and Mr. Musha by talking about the characteristics and distinct features of the recent plunge in stock prices.
Musha: I think that the October drop came as a complete surprise to most of the people who are following the fundamentals. The Nikkei Average fell by ¥2,200 during October, the largest monthly decline since the global financial crisis in 2008. This average was down 9.1% in October, the largest percentage drop other than the brief 9.6% plunge in June 2016 when Britain voted to leave the EU. So, October was a remarkable decline in terms of the absolute and percentage decreases. But the cause is not clear. Since no one knew the real nature of this bear market, the fear of investors snowballed and people panicked. The question is how we should interpret this situation.
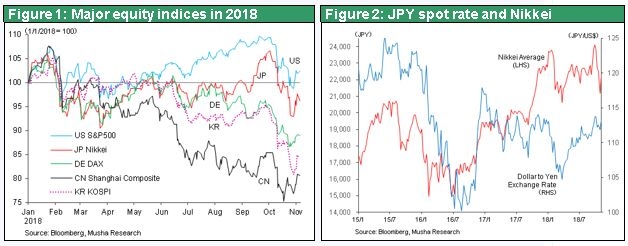
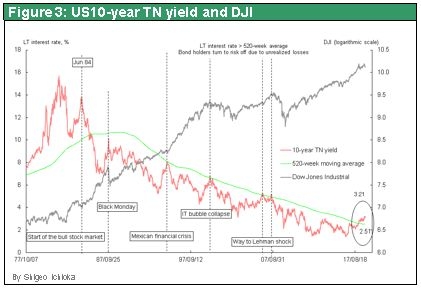
One defining characteristic of the October downturn is that stock prices fell worldwide but there were big differences from country to country. US stock prices are still higher than at the beginning of 2018. But stock prices are down 10% in Japan, 15% in Germany and Korea, and about 30% in China. Another important characteristic of the downturn is that volatility was limited to equities. Usually, a big drop in stock prices is accompanied by equally dramatic movements in prices of other financial assets. Furthermore, falling stock prices almost always cause the yen to appreciate. But this time the yen hardly moved at all, weakening slightly from ¥111 to ¥112 to the dollar.
The credit risk premium is one more unusual aspect of the October downturn. Normally, as a crisis mentality grows among investors, prices of corporate bonds, which are an investment with risk exposure, fall in tandem with stock prices. The reason is that people become afraid about the ability of companies to repay their debt because a weaker economy lowers earnings and causes bankruptcies. The risk premium is the additional interest rate that investors demand from financially weak companies. When stock prices fall, this premium should grow. Looking at a graph in Figure 8 of the change in the risk premium of BBB corporate bonds in the United States, we can see that this premium was larger during the global financial crisis in 2008 than even in 1929, the beginning of the Great Depression. Although the crisis ended, markets have been volatile briefly from time to time even during the subsequent prolonged period of economic growth. For instance, the risk premium increased during the crisis involving Greece and the euro in 2011 and the so-called China shock in 2015 and 2016. However, there was no significant increase in the risk premium in February or October this year. Investors should look closely at why these stock market downturns failed to spark turmoil in other financial markets.
(2) An explosion of pessimism and wariness – Do fundamentals justify this sudden drop in stock prices?
Sakurai: The drop came suddenly. In October, the Nikkei Average’s lowest point was about ¥3,000 below the month’s high. This was the biggest drop since the collapse of Lehman Brothers in 2008. When a downturn of this magnitude happens, most people conclude that there must be a serious problem involving economic fundamentals. Mr. Ichioka, what are your thoughts about this thinking.
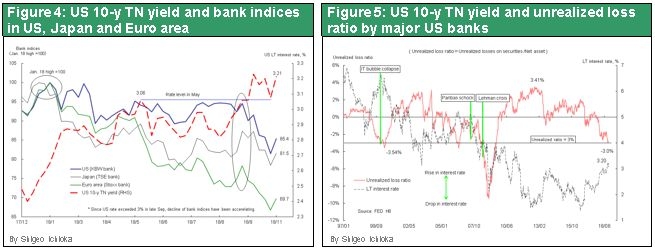
Ichioka: In one respect, I think this downturn was something that was waiting to happen. Rising long-term interest rates in the United States are the most important point. Figure 3 shows the US 10-year Treasury yield, the 10-year moving average of these yields and stock price movements. Red is the 10-year yield, green is the moving average and gray is the stock market. As you can see, a crisis always happens when the 10-year yield becomes close to the 10-year moving average. This coincided with Black Monday in 1987, the Mexico financial crisis (the “tequila shock”) in 1994, the bursting of the IT bubble in 2000 and the start of the global financial crisis in 2008. And now another crisis is taking place as the yield and its moving average converge.
We should note that the convergence of the 10-year Treasury yield and 10-year moving average does not always result in a severe financial crisis. During the Mexican currency crisis, stock prices were down only about 10% over two months. The crisis was almost complete resolved. Anyway, this crisis took place only overseas and there was no problem with US fundamentals.
However, we should be worried about the proximity of the 10-year Treasury yield and its 10-year moving average now. Institutional investors buy national government bonds almost every week. The average yield for 10 years (520 weeks) of purchases is the 10-year moving average. This is also the average cost of these bonds for institutions. Today, this moving average is 2.5% compared with the actual 10-year yield of about 3.15% (on November 1), a return that was up to 3.23% briefly. That means the bond portfolios of institutions have unrealized losses instead of unrealized gains as in prior years. When this happens, institutional investors adopt a risk-off posture and start reducing their assets.
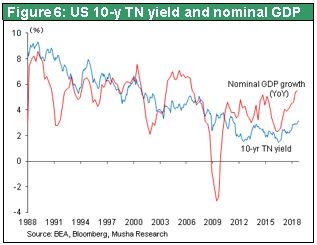
This can be seen in Figure 4. The blue line is the index for US bank stocks and the red line is the 10-year Treasury yield. In May, this yield exceeded 3% but for some reason the stock market remained calm. But when the yield once again exceeded 3% at the end of September, bank stocks immediately started to fall. There was a sell-off of bank and other stocks. Figure 5 shows the 10-year Treasury yield and unrealized capital gain and loss ratio of banks’ security investments. This ratio is obtained by dividing the unrealized gains or losses by banks’ net assets. The red line shows this ratio for major US banks. Today, net unrealized capital losses are 3% of net assets, which destroys 3% of net assets.
In the past, both the bursting of the IT bubble and the period immediately prior to the collapse of Lehman Brothers coincided with the net unrealized capital loss ratio surpassing 3%. The 3% level is clearly warning signal about upcoming events that should be taken very seriously. I think the point where this ratio surpassed 3% was the start of the October stock market correction.
Sakurai: Mr. Musha, what is your response to Mr. Ichioka’s remarks?
Musha: Mr. Ichioka’s analysis contains several points about which very few people are aware. This reinforced my own awareness of other types of risk that exist today. As long-term interest rate climb, the holdings of banks’ investment portfolios become weaker. And now losses have grown to a substantial level. The question is how much of an impact this portfolio issue will have on financial markets and the economy. Right now, I believe there is no serious problem. Balance sheets of US financial institutions are much stronger following a series of stress tests after the global financial crisis. The reason is probably that loan assets were sufficient to offset losses on bond holdings. The Fed is undoubtedly monitoring the soundness of banks and there is no word from the Fed about any danger. I don’t think there is any risk in the near future of damage to US bank balance sheets that would lead to a reduction in lending and the start of a negative credit cycle. Furthermore, the interest on banks’ loans move up when long-term interest rates climb, so higher interest rates give banks a bigger interest margin. Consequently, rising interest rates erode the quality of banks’ bond holdings but at the same time can contribute to higher earnings.
Here, we need to focus on the level of US long-term interest rates, which are now above 3%, in relation to the overall economy. When we look at where interest rates are, we must take into account the actual health of the economy.
Figure 6 compares changes in long-term interest rates and nominal GDP growth rates in the United States. These growth rates are the result of economic activity in which interest rates are the expenses paid to obtain benefits. This is why it is vital to look at the relationship between these benefits and expenses. Nominal economic growth in the United States has increased to almost 6%. The US economy is clearly healthy. Although long-term interest rates have moved up to more than 3%, we can conclude that interest rates are still sufficiently low in comparison with actual economic conditions.
In the 1980s and 1990s, US long-term interest rates were about the same as the nominal economic growth rate. But during the past decade or so, interest rates did not increase even though the US economy was sound. Former Fed Chairman Alan Greenspan called this a conundrum. For companies, this created an environment that made it easy to generate strong earnings and increase risk exposure because interest rates were low even though their business operations were performing well. No significant change has taken place in this favorable environment despite the upturn in interest rates to more than 3%. I don’t think US interest rates have reached a point where we need to worry. Nevertheless, there may be a chain reaction of risk in the future if interest rates move up in 2019 and 2020 to 4% and then 5%. Investors need to be vigilant about this and constantly keep an eye on interest rate movements and associated risks.
Sakurai: Mr. Ichioka, what is your response to Mr. Musha’s remarks?
Ichioka: Mr. Musha is absolutely right about the United States. The performance of US banks is not weakening. Figure 7 compares bank stock indexes in Japan, the United States and Europe after the lowest point during the global financial crisis. Red is Japan, black is Europe and blue is the United States. As you can see, US bank stocks were up by a multiple of six at one point and are currently still five times above the low point. During the financial crisis, the credit spread, which is the difference between the 10-year Treasury yield and BBB corporate bonds, became larger. But during this stock downturn, there was no worsening of the credit spread. This is why I don’t think there is any need to worry about the United States.
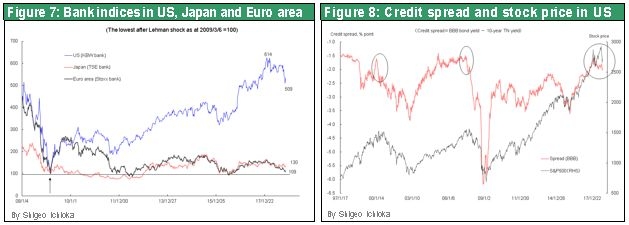
The 1994 currency crisis in Mexico had almost no effect on US stocks. But this crisis did create problems in emerging countries. Now, similar problems may be appearing in emerging countries. Prices of bank stocks in the eurozone are currently only 9% higher than at their bottom during the global financial crisis, as shown in Figure 7. Perhaps this is where the real problem is hidden. Another potential problem is China.
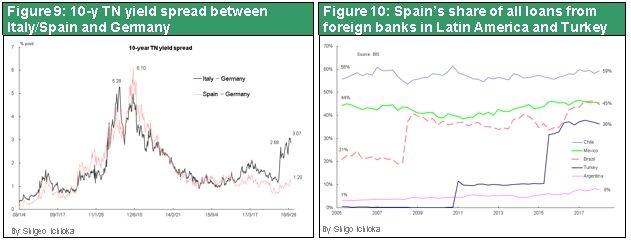
In Europe, Italy has a popularist government that is proposing a budget that the EU does not accept. The budget dispute has widened the gap between interest rates in Italy and Germany to the highest level since the Greek debt crisis in 2011. Now the interest rate gap between Spain and Germany has started to grow. Worries about Spain are linked to this country’s enormous share of loans to countries like Brazil, Argentina, Mexico and Chile where concerns about external debts and currencies are climbing. There are also worries about Spain’s loans to Turkey, where the debt problem was recently in the news. Spain’s share of all loans from foreign banks is 59% in Chile, 45% in Brazil and Mexico and 36% in Turkey, as shown in Figure 10. Problems in these countries could trigger a big crisis.
China’s growing amount of debt is another problem. As you can see Figure 11, which shows the increase in debt of major countries since 2009, China’s debt have increased by $28.5 trillion and US debt are up by $13.8 trillion. By comparison, debt in Europe, Canada and Australia are up by a total of $12.8 trillion, all emerging country debt excluding China are up by a total of $11.1 trillion and Japan’s debt have increased only $0.8 trillion. China alone has accounted for 40% of the growth in debt while Japan’s debt has hardly increased at all.
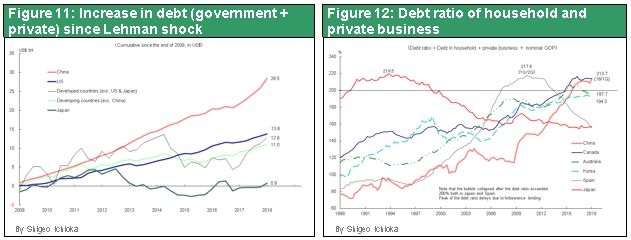
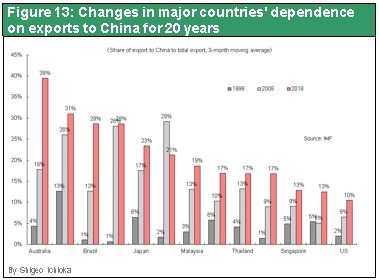
Household and private-sector corporate debt as a percentage of GDP, as announced by the Bank for International Settlements, is shown in Figure 12. In the first quarter of 2018, debt was at the crisis level of 213.7% in China. The line at 200% is the point at which an asset bubble has formed in the past. At the end of 1989, household and corporate debt in Japan was more than 200% and the country’s asset bubble burst shortly afterward. However, Japan’s debt ratio continued to climb as banks extended more loans to support companies in trouble. As a result, this ratio peaked at 219.5% in the fourth quarter of 1993. In Spain, this ratio passed 200% in 2005 and 2006. Soon afterward, the country’s housing bubble collapsed and then the global financial crisis began. Today, private-sector debt is near 200% of GDP in China, Canada, Australia and Korea. Canada is home to many immigrants from China, Australia relies on China for 39% of its international trade and Korea for 31%. The strong ties with China of these three countries mean that China is linked to the big increases in their debt ratios. With debt this high, an upturn in interest rates is a frightening prospect.
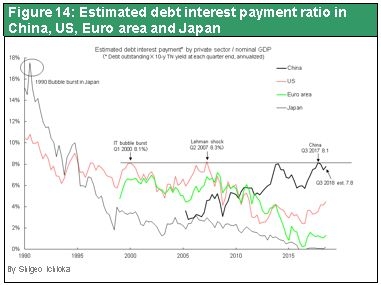
Higher interest rates would dramatically increase the amount of interest payments on private-sector debt. Figure 14 shows private-sector debt interest payments as a percentage of GDP in the United States, China, the eurozone and Japan. Interest payments are estimated by multiplying private-sector debt outstanding by the yield of 10-year bonds at the end of each quarter. In the United States, the interest payment ratio was 8.1% when the IT bubble burst and 8.3% during the global financial crisis. In China, this ratio was 8.1% in the fourth quarter of 2017 and is now 7.8%. However, interest rates on China’s private-sector debt are probably much higher than the yield of the country’s government bonds. Also, China’s GDP statistics are probably significantly inflated. For these reasons, private-sector interest payments in China are very likely far higher than 7.8%. This is why China is the biggest source of concern.
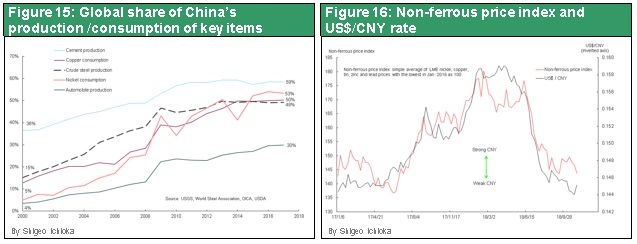
Surprisingly, many people are unaware that China accounts for a very large share of the world’s consumption and production of basic materials. For example, China accounts for 59% of the world’s cement production, 53% of copper consumption, 50% of nickel consumption and 49% of crude steel production. In addition, 30% of all automobiles made worldwide are assembled in China. It would be impossible to ignore the negative impact on the global economy of an economic downturn in China. Movements in the non-ferrous metals price index demonstrate the reliance of the global economy on China because the index is virtually linked to the Chinese yuan. The yuan can be used as an indicator of the health of the Chinese economy. You can see that prices of non-ferrous metals fall when China’s economy weakens. In Japan, the non-ferrous metals and marine transport sectors suffered the biggest drops in stock prices in 2018. I think the slowdown of China’s economy is the cause. I believe the issues I have just covered will be the main risk factors for the time being.
Sakurai: Mr. Musha, what are your thoughts about Mr. Ichioka’s remarks?
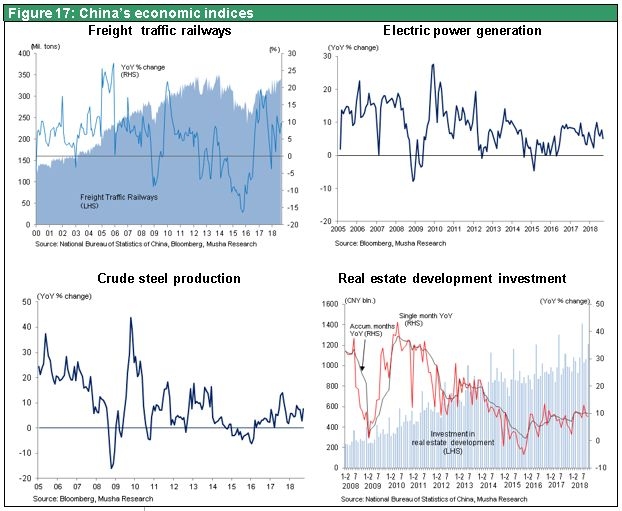
Musha: There are definitely many risks involving China. I completely agree with Mr. Ichioka’s statement that their debt or other financial problems in the future in China could create a global instability. But I think it is still too early to say that the Chinese economy is headed for that type of crisis. Figure 17 has graphs of four microeconomic statistics for China: railroad cargo volume, crude steel production, electricity generation and real estate development investments. All four are more reliable short-term indicators of their economic health than GDP, which is not directly linked to actual economic conditions.
After the global financial crisis, the most difficult period for China’s economy was during the China shock of 2015 when the yuan was devaluated. At that time, all four of the microeconomic indicators were decreasing. Furthermore, there were problems involving financial and foreign exchange markets as well as a downturn in the real economy. China used a variety of policy initiatives to turn the economy around and now all four indicators are increasing. Most significantly, real estate development investments have been growing at a rate of about 10% following the 2015 decrease. Furthermore, China is still making these investments, even though residential projects are being made in places where no one is living.
Chinese economy is hard to collapse in the near future. In addition, the Chinese government has started monetary easing and spending programs on a massive scale to prevent the US-China trade war from having negative consequences. China is increasing infrastructure expenditures, including a plan for a high-speed rail line to Tibet. There are doubts about the profitability of infrastructure projects. But if China actually makes these expenditures, economic growth will not lose momentum. Right now, separately from other risk factors that are currently out of sight, I think China is simply propping up the economy. Also, I believe that rising US long-term interest rates will eventually trigger a crisis in China. But this will probably happen after a while rather than now.
Sakurai: Both of your conclusions give us some reasons to worry about China. But are these risk factors potential causes of a crisis rather than problems that may quickly start a crisis?
(3) The transformation of global stock markets – Why did a downturn of this magnitude happen?
Sakurai: Both of you have agreed that there are no serious problems with fundamentals, the economy, politics and other elements of the actual situation today. If so, why did stock prices fall so much? Mr. Musha, what is your opinion?
Musha: I think technical factors are most likely responsible for the two big stock price drops that happened this year. The first reason is the fundamental transformation of stock markets caused by the growth of AI trading and index ETFs. During the past few years, commodity trading advisor (CTA) funds, risk parity funds and other entities have become the main players in stock markets. All of these new players use AI trading, which means machines make buying and selling decisions. (A CTA fund is a hedge fund using algorithms that cover all types of financial instruments. A risk parity fund is a hedge fund using algorithms that automatically adjust the risk exposure of portfolio assets to maintain the same level. For example, if stock prices fall, the fund automatically sells stocks.) Computers that control massive amounts of investments by using virtually unlimited amounts of data with no vulnerability to human emotions will always beat human traders. People try to buy low and sell high but often end up doing precisely the opposite. The age when people traded stocks based on gut feelings, intuition about price movements and similar emotional factors has come to an end.
Another big change is the declining importance of bottom-up approach that requires studying stocks and companies one by one. Instead, index funds and ETFs have become the main vehicles for channeling money to stocks. Index funds have increased from 19% of all US stock mutual funds in 2009 to 44% in 2018. A huge volume of money is being directed to stock investments using a top-down method that begins with macroeconomic data. These funds are toying with stock markets by buying and selling stocks in specific indexes. However, AI trading and index trading are both neutral from a long-term perspective. They must always buy back whatever they have sold. As a result, speculative selling is likely to be followed by enormous speculative buying.
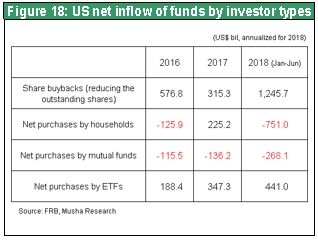
Blackout periods are another internal force that influences stock markets. There is often a so-called blackout period during approximately four weeks before an earnings announcement when stock repurchases are suspended. Apparently, investors have been targeting this period for speculative selling. During the past few years, stock buybacks have been by far the largest component of stock purchasing in the United States. Individuals and mutual funds have consistently been the primary sellers. Between the start of 2015 and the end of the first half of 2018, stock buybacks totaled $2,060 billion and there were net sales of $410 billion by individuals and $330 billion by mutual funds. Due to this situation, the supply-demand balance tips extremely to the sell side during blackout periods. Speculative selling becomes much easier and more effective as a result. In fact, the stock sell-offs at the beginning of February and October this year both took place at the beginning of blackout periods. For these reasons, investors can expect an enormous reversal in stock supply-demand dynamics when a blackout period end.
All of these points indicate that the October stock market downturn may end up serving as a springboard for a rebound starting late this year or early in 2019.
Sakurai: Mr. Musha believes that internal characteristics of the stock market are responsible for these dramatic downturns. What is your view, Mr. Ichioka?
Ichioka: Mr. Musha made an excellent point concerning price movements during blackout periods. There is no doubt that the widespread use of AI trading makes it very difficult for ordinary investors to win. Even go and shogi players are losing to AI. Computers are winning by using unexpected measures that are outside the bounds of generally accepted tactics. I think the same thing is happening in the stock market.
(4) The outlook from an optimistic standpoint
Sakurai: Both of you think that internal stock market factors are responsible for the big drops in February and October and that there is no need to worry about fundamentals. Does that mean everything is basically all right at this time? Please explain your outlook for the market. Mr. Ichioka, you are first.
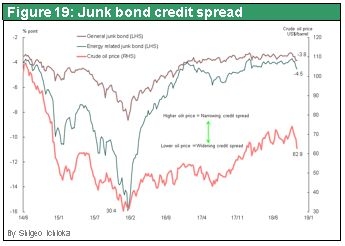
Ichioka: Crude oil will determine the upcoming direction of the stock market. Earlier, we noted that the spread between corporate and government bonds is not increasing. The spread between junk bonds and government bonds is clearly the case. The reason is that those issued by oil companies operating in the United States are the benchmark junk bonds. The financial soundness of these companies has declined as they borrowed more money. When the price of oil is high, however, the junk bonds of these oil companies are popular and there is a smaller increase in the credit spread, as Figure 19 shows. In other words, this credit spread widens when the price of oil falls. Now there is no need to worry. But there could be a problem if oil retreats to the $50 level.
Sakurai: Mr. Musha, what is your outlook?
Musha: Risk will increase if there is a sudden drop in the price of oil along with a big drop in global demand for oil. This is likely to happen in China, not the United States. Investors must carefully monitor the situation in China because of the risk of a downturn of the real economy. In 2015, the world experienced the fear created by a potential economic freefall in China. Although there is a problem from a long-term perspective, I think China will prop up the economy over the short term and that this will support financial markets. The 2018 G20 summit will take place in Argentina at the end of November. At this gathering, we could see the trade war settle down for the time being. China may reach an agreement with the United States or perhaps give in to some US demands. The United States has reimposed economic sanctions on Iran. China has been critical of this move and was the only major country to continue buying oil from Iran. However, according to the Wall Street Journal, China stopped buying Iranian oil in November and will support the U.S. sanctions. In fact, China has started giving in to make some compromise on various demands made by the United States. The US-China trade war will last for a long time. But an excessive short-term impact of this war on the economy and financial markets would be self-destructive for both China and the United States. This why I think a resolution will be reached at some point.
There are unquestionably a few potential problems worth worrying about. One is a US-China cold war. Another is a sudden drop in oil prices as the Chinese economy weakens that results in the start of a negative economic cycle. Also, rising interest rates could cause a chain reaction of financial instability. But I think it is obvious that we do not have to worry about these problems for the time being. Also, although AI trading and ETFs are creating market turmoil, their impact on markets is fundamentally neutral. AI traders and ETFs buy back stocks that they sell, so we can expect to see a powerful rebound in stock prices late this year or early in 2019.
(5) What should investors do?
Sakurai: In closing, what is your advice for investors?
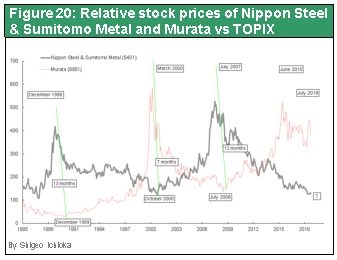
Ichioka: When seasons change in Japan, there are storms as spring starts and typhoons in summer. The same is true of changing seasons in financial markets. During the past five years, high-tech stocks have been strong while the stocks of steel, non-ferrous metals and other heavy industries have performed poorly. When stock prices fall suddenly, the major leaders of the market change. Figure 20 shows a comparison of the stock prices of Murata Manufacturing, which makes electronic components, and Nippon Steel and Sumitomo Metal. This graph shows that heavy industry stocks peaked just before the February downturn when high-tech stocks were low. Then high-tech stocks reached their peak prior to the October downturn when heavy-industry stocks were out of favor. I think a stock market rally will begin late this year or early in 2019. If this happens, the rally will not be fueled by the high-tech stocks that have been climbing consistently. Instead, I think heavy industry, energy and non-ferrous metals will be at the center of the rally. Energy and non-ferrous metals stocks have been showing poor performance because of problems in China. A recovery of demand in China and return to health of financial markets would be good news for the Japanese economy, too.
Musha: China bashing by the United States is producing benefits for some countries. The US feud with China may prevent companies from making capital investments in China or prompt companies to pull their money out of China. Many companies have started creating new manufacturing facilities to replace operations in China. The start of expenditures to build these factories in other countries will have a positive effect on the global economy. Partly because of low stock prices, the global economy could be flat for a while. However, the global economy may regain its vitality in the first half of 2019.
To investors, I say do not compete with artificial intelligence. Beating AI traders is impossible, just as with go and shogi. Investors must avoid such stock investing activities as may result in no hope of winning.
When there is an excellent buying opportunity at a low price, investors should not be moved by fear to feel obligated to sell their holdings. Use surplus funds that will not be needed soon for long-term investments that do not entail excessive leverage. This is the shortest path to earning good returns.
Sakurai: Thank you for sharing your economic and market insights today.
Ichioka/Musha: Thank you.