Mar 26, 2019
Strategy Bulletin Vol.222
A Major Shift Away from Total Pessimism is Approaching
- Discussion with Mr. Hakoda about the Prospects for the Stock Market using the Argo method
Collaboration between the Short-term View from Mr. Hakoda's Price Index and the Analysis of the Long-term Fundamentals of Musha Research
Q) The global stock market is now at a standstill after the sudden rebound in January-February. In the NY market on March 22, NY Dow Industrial Stocks fell by $460, down 1.9% from the previous day, the second largest drop this year. The Nikkei Average on March 25 continued to fall sharply by 650 points, or 3.01%. Whether this is a true turning point in the trend or just a plateau, is the issue we are considering on this occasion with our guest President Hakoda, Financial Data Solutions, Inc., who is promoting the Hakoda method of short-term market forecasting with his own algorithm and whom I delighted to welcome to discuss the current outlook. The Hakoda method has attracted a great deal of attention by accurately pinpointing the timing of two sharp falls last year. Firstly though, I would like to ask what is the current point of view of Musha Research?
Sharp Decline at the End of March is a Great Buying Opportunity
Musha) I think this decline is a plateauing out that will form the base for a long-term rally and, as such, represents a great buying opportunity. The reason for this view is that the global economy is not falling into a recession, but rather that it is extremely likely that both the US and China economies will become more buoyant. Some of the factors supporting this view are that: (1) The concerns over last year's decline factors have almost disappeared (US monetary tightening, US-China friction, China's economic slowdown); (2) the US and China have both made a major policy shift towards boosting economic activity; (3) the only, and biggest, concern was that the sharp decline in stock prices at the end of last year would be a trigger for a self-fulfilling economic downturn, but the economic psychology did not deteriorate much, and US and Chinese stock prices recovered most of the decline in two months; and (4) people's excess pessimism is strong and, this is undoubtedly a powerful factor. If our view proves to be correct, there will be some big positive surprises ahead for the stock market in the future.
Q) President Hakoda, please tell us how last week’s sharp fall is assessed on the basis of the Hakoda method. Furthermore, it’s fair to say that, with the Hakoda method, the thinking about the short-term market is based on the regularity discovered by your own original algorithmic analysis of the past price information, isn’t it?
Should be Cautious in Early May
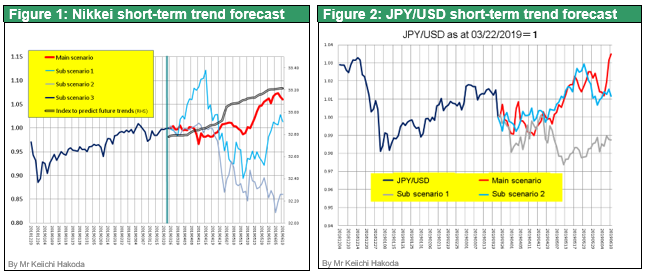
Hakoda) Yes, that is fair to say for the Hakoda method. Now, however, I would like to outline the FDS’ (Financial Data Solutions) interpretation of the market price decline on March 22. The conclusion is that the latest fall is a rising market turning point, and indeed rather a good buying opportunity. Figure 1 shows the near-term forecast of the Nikkei Average based on our algorithmic analysis, with solid market conditions continuing on from the end of March until the May holidays and then, after passing through a cautious period in response to an adjustment in US stock prices looking likely in early May, we think it’s reasonable to say there is a strong possibility that prices will rise into June. The three scenarios in the figure are the market trends detected from similar patterns in the past, and the main scenario with the highest probability is shaped similarly to the Hakoda method’s conclusion.
The Hakoda method could not predict the sharp fall in the US and Japanese stocks seen on March 22-25. However, the method had expected a sharp drop in 10-year US bond yields. A sharp drop in the 10-year bond yield has led to a reversal of long and short interest rates, which may have triggered the algorithm's sell command. However, the fact that it could not be predicted by the Hakoda method means that the fall in stock prices was very widely divergent from the regularity in the past and so, if there was no basis in the fundamentals for the fall, it should therefore be possible for it to reverse out for the same reason. US Dow Industrial stocks are expected to hit record highs by early May. The Hakoda method generates two outputs, Sea Change (a turning point of the market price) and Poisson (the market trend), but US stock price formation is expected to hit ceiling points on May 10-14.
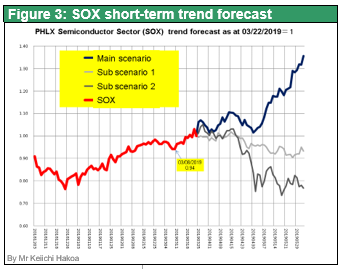
Predicted the dollar-yen rate by the Hakoda method, after the yen has weakened for a while, the yen will turn higher after May 10, and the tide of the yen will then turn down again towards weakness at the end of May. Figure 2 is a short-term market pattern forecast from similar patterns detected in the past.
Q) President Hakoda, I believe that you also validate/inspect data in terms of fundamentals and stock supply and demand, separately from the Hakoda method. Could you perhaps point out some of the indicators that you are focusing your attention on at the moment?
Big Boom Forecast, Semiconductor Stock Prices at Record Highs
Hakoda) I am currently focusing particularly on: 1) the US Semiconductor Stock Index; 2) Nikkei Average constituent sectors; 3) business forecasts and EPS trends; and 4) the trends in Japanese stock cancellations and in the number of issued/outstanding stocks in the Nikkei Average. First of all, the US Semiconductor Stock Index (Sox index) has risen by 35% since the beginning of the year, and it has not only recovered from the sharp plunge of late last year but also the record high level it achieved in March last year. It remained relatively solid even during the sharp drop on 22 March. This may indicate that the US manufacturing industry's short-term dips are now coming to an end. By using our tide-calculation system to search for similar periods in the past, the years 1996 and 2012 emerged. Both were the starting points for large rises. Figure 3 illustrates the similarities in the past that are future market forecasts detected from the turn, and the main scenario is expected to see rapid growth in market prices.
Japanese Stocks, Especially High-Tech, Lagging Behind
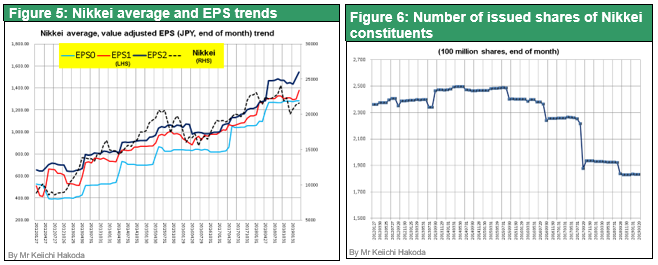
Next, I will focus on the Nikkei Average tri-segment sector trends. The three sectors are: 1) 3 core stocks (KDDI, Fast Retailing, SoftBank); 2) Electricals + Chemicals; and 3) Others, and the composition ratio is, respectively, 1) 15%, 2) 29%, and 3) 56%. Figure 4 shows the trends in the three sectors and in the Nikkei Average starting from January 31, 2018, but the Electricals + Chemicals sector was the main driver of the market decline recorded since October last year. The Electricals + Chemicals sector consists of high-tech parts, materials and machinery, and is export-oriented, mainly to China, and so is highly sensitive to global economic fluctuations. It is therefore also undoubtedly true that it was badly affected by the US-China trade war and by the slowing of the Chinese economy. The recovery in the Electricals + Chemicals sector has been significantly delayed in comparison to the US SOX index, but if a catch-up does occur, it will provide a major boost to the Nikkei Average in the future.
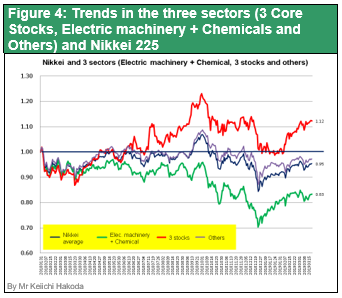
Figure 5 shows the forecast for the Nikkei Average earnings per share (EPS) and the trend in the Nikkei Average, but it has recently become clear that, while the EPS forecasts for the two periods have risen sharply, share prices have fallen with the result that the divergence between the two has now expanded more than ever. This is a factor that will drive a rise in share prices in the near term. One reason for the rise in EPS is a decrease in the numbers of shares outstanding due to share buybacks and cancellations. Figure 6 shows the trend in the change in the number of shares outstanding for the stocks in the Nikkei Average, and illustrates that the total number had decreased substantially toward the end of 2018. For reference, there are two charts at the end of this report that show the treasury stock cancellation amounts (Figure 15) and the cumulative treasury stock cancellation amounts (Figure 16).
Q) It seems that President Hakoda's explanation above largely overlaps with the optimistic outlook of Musha Research. Could you perhaps expand on Musha Research stance’s here please?
The Bad News Has Been Excessively Factored In
Musha) What can be said about the fundamentals is nothing particularly new now. In fact, it’s almost impossible to think that any major changes in direction are likely to happen.
(1) The US economy
It will refocus on positive fundamentals in June, the longest economic update ever, and on the upturn in economic indicators. Controversy will concentrate on identifying what exactly is the intrinsic strength of the US economy that has led to the longest economic expansion in history and will likely further strengthen market sentiment. (Please see Strategy Bulletin 221)
(2) US monetary policy and interest rates
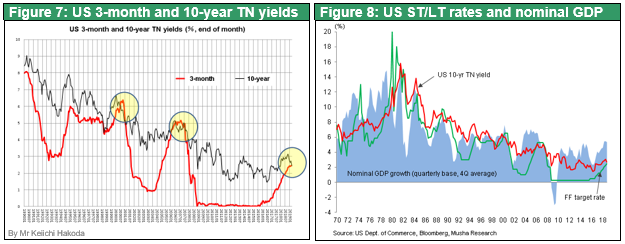
The inversion in the yield curve that the markets are worrying about is an absurd case of needless anxiety. Up to now, the inversion in the yield curve (rising inflation ⇒ short term interest rates rise ⇒ inverse yield curve), and this time it is the exact reverse (low inflation ⇒ long-term interest rates fall due to the Fed's market friendly stance⇒ inverse yield curve). Also, as shown in Figure 8, the level of interest rates is completely different from that prevailing at the time when the recession was triggered by the past reversal of interest rates. Formerly, long and short interest rates rose to levels above nominal GDP growth rates. Currently however, both long and short interest rates are half the level of nominal GDP growth rate, and the cost of capital is still at a level to stimulate both the economy and entrepreneurial risk-taking.
(3) US-China friction and the Chinese economy
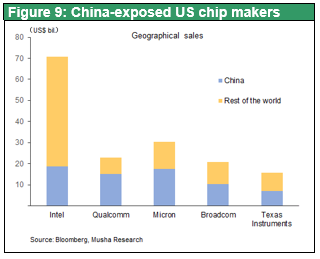
It will be certain to soon come to an end with a US victory, and that the uncertainty will disappear, and that the Chinese economy will start to feel buoyant again. Otherwise, it clearly cannot be expected that the share prices of US semiconductor companies, which account for nearly 50% of sales to China, and that the Shanghai Composite Index will be able match the highs hit last year.
(4) Europe's economy and Brexit
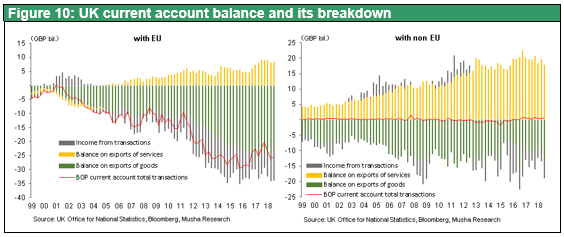
Brexit has been a ridiculous farce. Most of the pessimism now sounds ludicrously wrong, given the soaring surge in global stock prices immediately after the Brexit decision was taken in the June 2016 referendum. All the scenarios have already been dealt with, and if the conclusion ultimately emerges the uncertainty will disappear too. The transformation of the Chinese economy will surely eliminate the unrest in Germany too. Figure 10 shows the trends in the UK current account balance, trade balance and service balance, with EU and non-EU countries. The UK is a big customer for the EU, therefore it is the EU's side that will suffer from Brexit. The EU has to make sure that its exports to the UK are not reduced as a result of any tariff adjustments being made. Or is it likely to make adjustments through the exchange rate (pound sterling high, euro low) so that serious damage to the economy can be avoided?
(5) Japan Economic Indicators
Japan’s economic downturn are both expected to make a major positive turnaround in, with positive two changes, namely in: 1) China's rapid slowdown (due to US-China friction and China’s market reforms); and 2) a psychological downturn due to stock prices falling.
(6) Japan policy
Possibility of additional monetary easing, and that negative effect of the consumption tax hike is likely to offset by fiscal spending, and in Japan, there will be a rising trend in favour of publicly-financed stimulus spending projects, such as such as MMT (Modern Monetary Theory), in public opinion in Japan.
Q) Even so, it is foreign investors that are causing the stock price volatility. The major change in the arbitrage buying volume is also due to the selling of Japanese stocks by foreigners. Foreign investors seem to be still bearish on Japanese stocks, so what could cause a revaluation of Japanese stocks?
Extremely Speculative Japanese Market, High Volatility
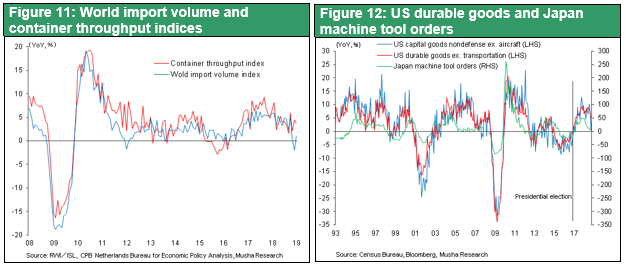
Musha) Japanese stocks specialize in the capital goods and production goods needed for the international division of labour which are the most sensitive to economic fluctuations and, therefore, have been strongly affected by the decline in production since the end of last year. This is a state of affairs that will rebound strongly in the future. It has been suggested that the trend in the movement in the prices of US semiconductor stocks has already entered a rebound phase. Figure 11, showing world trade and container handling volumes, and Figure 12, showing US durable goods orders and Japanese machine tools orders, both serve to illustrate the short-term circulation in the world's physical economy. It stalled during China's market reforms and the US-China Trade War in 2018, but the peak is low, and so it is almost certain that there will be a bottoming out sooner.
The Japanese stock market is the world's most speculative and volatile market
(1) The Japanese economy is becoming more service-oriented, but the degree of reliance on manufacturing for Japanese stocks is almost 50% of the total. Moreover, because of the focus on capital goods and production goods (B to B), the amplitude of the pendulum swing between production and performance is greater than in other markets.
(2) Japan-specific exchange rate fluctuations increase the frequency of economic fluctuations. Recession ⇒ appreciation in the yen, favourable economic conditions ⇒ depreciation in the yen
(3) Due to the (extremely wrong) risk-aversion stance of the Japanese investors, equity trading is led from overseas by foreigners (70%), with just 30% accounted for by domestic participants. Consequently, it becomes prey to speculative trading by foreigners, especially using futures.
Speculative Sales Forming the Basis for Overblown Speculative Buying
However, the GOOD NEWS is that speculation and trading are direction-neutral. Speculative sales trigger speculative buying later by nature.

Finally, I would like to take a look at the trends in the Nikkei Average and in the arbitrage buying position shown in Figure 13. The trend in the arbitrage buying position, which represents the level of speculative selling, mainly by foreigners, is closely linked to the Nikkei Average. In particular, the bottom values of arbitrage buying position and average share prices are almost exactly coincident with each other. This is because the bottom price of Japanese stocks is recorded in response to downward pressure from speculative selling. The arbitrage buying position at the 500 billion level (Figure 13) and Arbitrage Buying Position / TSE First Section Capitalization Ratio of 0.2% (Figure 14) are clear proof of speculative sales reaching their limit. In 1998, 2003, 2009 and 2016, share prices increased by more than 60% within periods of one to one and a half years. The fact that the arbitrage buying position reached this level in December 2018 (Nikkei Ave. bottomed at 18,949 yen) thus means that the Nikkei Average may reach 30,000 yen by mid-2020.
In a new era with a new Emperor, a wind is also blowing a fresh start across Japan. It may not be long before pessimism is shattered.

Mr Keiichi Hakoda
Keiichi Hakoda established Financial Data Solutions Inc. in December 2007. Prior to this, he worked for Nikkei Quick and developed an application for equity risk models (NPM) in 2000. He also worked for BNP Paribas Securities in 1999. He worked in the Information Division and Stock Trading Division of Daiwa Securities Co., Ltd. after he graduated from Faculty of Engineering, Yokohama National University in 1986.