Sep 09, 2019
Strategy Bulletin Vol.232
Bond Bubble and Share Buybacks
- Huge Barrier between Debt and Equity
(1) Bond Bubble Caused by Policy and its Consequences
Speculation is Progressing with the Safest Government Bonds
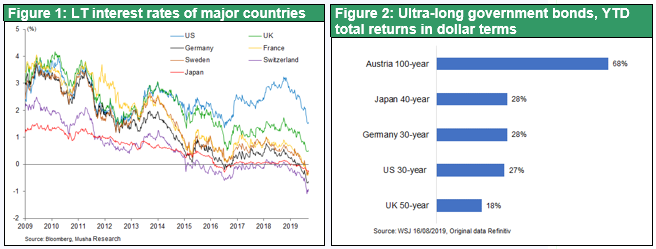
This summer, global long-term interest rates have dropped sharply (bond prices soared). German 10-year government bond yields fell to -0.7%. These investments, which will surely generate losses if they are held to maturity, are speculative holdings taken solely in the expectation of further price increases. It is therefore entirely fair to call this a bubble. The Wall Street Journal reported that the return (dollar basis) has reached 68% of Austrian 100-year government bonds, 28% of Japanese 40-year government bonds, 28% of German 30-year government bonds, and 27% of US 30-year government bonds.
Until now, the conventional wisdom in the market is that government bonds is the target of investment by investors who wanted to avoid risks. The interpretation of this was that investment in government bonds is preferred for the purposes of asset conservation when unease and crisis awareness about the future economic outlook increase. However, people are now buying government bonds as a risk-taking measure rather than acquiring government bonds in order to avoid risks. I wonder why this should be so?
Bond Bubble Background
The first point to be made is that the global surplus is advancing, bringing down long-term interest rates and causing a bond bubble. However, the dividend yield is sufficiently high at 2-4% in Japan, the US and Europe, and no bubble has occurred in the world of equities. On the contrary, stocks are significantly cheaper, and their share values are rising due to the increase in profit margins. With no funds now going into these high-return stocks, a huge amount of capital remains in the Debt (broadly defined, bond) sector, which has significantly low returns, thereby further reducing interest rates. There is a huge barrier between Debt and Equity, and mutual capital flows are not moving back and forth between them. I wonder why this should be so?
More Important Factors are Policy and Institutional Bond Preferential Treatment
The Most Important Reason is the System and Policy.
- The risk weightings in BIS regulations are zero for government bonds, 100% for stocks now, and 250% for the medium term. If banks hold stocks, the risk increases, and capital must be provided. In other words, if you have the same amount of capital, the stock holding will be restricted.
- Accounting standards. Stocks are subject to the lower of cost or market method, and if a stock price falls at the end of the period, a loss will occur immediately. On the other hand, the historical cost method is applied to government bonds, so even if the price falls, there is no need to record a valuation loss and it can continue to be held. Therefore, this results in an extremely preferential treatment being applied for bonds and an attitude of “cold shouldering” in the treatment applied for stocks in the calculation of the costs of holding by banks and institutional investors.
- Government bond prices were raised by the large-scale purchasing of government bonds by central banks through quantitative monetary easing policies in Japan, the United States, and Europe.
Thus, holding government bonds s is low in cost, but high returns can be expected, and so funds continue to flow unilaterally into government bonds.
Almost All Surplus Savings Have Flowed into Bonds
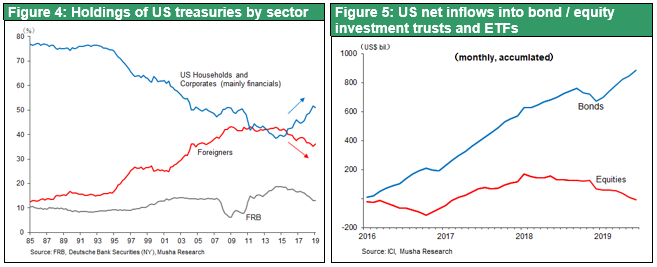
Even in the most strongly risk-motivated United States, all the surplus funds available in the 10 years since the Global Financial Crisis have flowed into bonds, and especially government bonds, and there has been absolutely no movement towards making any stock purchases. Figure 4 shows changes in the ownership ratio of US government bonds by entity, but it is clear that, since 2015, the US household and financial sectors have taken over all of the reductions in US government bond holdings made by the Fed and overseas sectors. Looking at net inflows into investment trusts and ETFs, it is clear that funds have flowed exclusively into bond investment trusts and ETFs, and that funds have continued to flow out of stock investment trusts and ETFs (Figure 5).
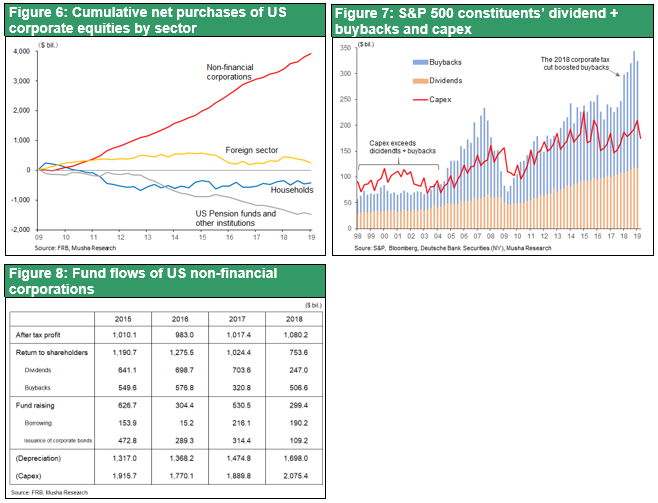
As shown in Figure 6, when looking at the flow of funds from US households, pensions, and investment trusts since 2009, all the surpluses go into bond investments, and the flow to stocks is negative for all three. Looking at the cumulative stock investment since 2009, the net sales amount was 0.4 trillion dollars for households and 1.5 trillion dollars for pension and insurance.
Thus all U.S. investors are pessimistic about equities and have been reducing equity investment. In terms of income returns comparison stocks are significantly higher than for bonds. These indicate that US stocks are in no way in a bubble. A number of experts have stressed that there is a bubble in bonds so as to claim that this is also to say that there is a bubble in stocks too, but this is mistaken in our view.
Since the core of financial market is the Debt (broadly defined, bond) sector and the Equity sector is a subordinate field, there may be a commonsense objection that it is only natural that funds are concentrated in Debt. But in the US financial markets now, the scale of both are almost neck and neck. At the end of 20091Q, the Debt balance was 52.6 trillion dollars and the Equity balance (market capitalization) was 48.0 trillion dollars. It cannot be overlooked, however, that the unequal and unfair treatment of Debt and Equity hinders capital movements between the two and makes financial markets dysfunctional.
(2) Share Buybacks Make US Finance Function
Consequently, while all the surplus in the United States is heading towards bonds, the only source driving investment in stocks has been share buybacks (US$ 3.9 trillion for 10 years). In the 10 years since the GFC, the only driving force that increased US stock prices 3.5 times was share buybacks.
Differences Between Japan and Europe, that Plunged into Zero Interest Rates, and the US
Japan and Europe fell into zero interest rates at both the long and short ends of the range, the spreads between long and short interest rates disappeared, and banks’ interest rates were completely flattened or reversed, so banking business was unable to make any profit in either the deposit and lending business or in the bond field. The performance of bank stock prices is at its worst ever level, especially in Europe and Japan, and even below the lowest prices recorded during the period of the GFC. Only in the US are interest rates are functioning properly with bank profits, so far, remaining healthy and only in the US have bank prices returned to pre-GFC levels. Where is this difference coming from?
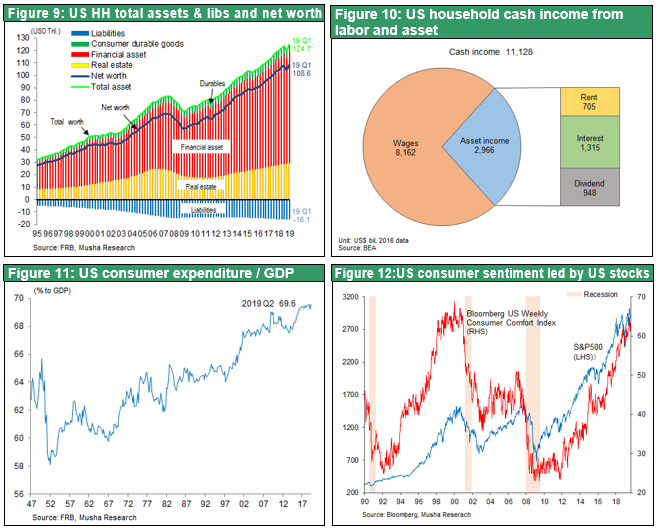
In Europe and Japan, new savings by companies and households have stayed in the world of Debt, resulting in negative interest rates. Similarly, in the case of the US, all surpluses in households, pensions, and insurance went to Debt. However, only corporations pour huge money into equity market with share buyback, leading to higher stock prices. The increase in household net worth centered on these elevated stock valuations is supporting US consumption. Since 2009, the net worth of US households has increased by US$60 trillion (three times GDP) from US$49 trillion to US$108 trillion. Equity assets increased from US$5 trillion to US $17 trillion, and pension assets increased from US$10 trillion to US$27 trillion. It can be seen that this circulation of capital, starting with share buybacks, raises asset prices and is the driving force for US consumption. Figure 10 shows the ratio of US household cash income, with 27% being asset income and 73% being labor income, illustrating how crucially important sound financial markets and stock prices are for household consumption. Figure 12 also shows that consumer sentiment is lagging behind stock prices. From these data indications, it can be seen that the strength in stock prices driven by buying stocks was decisive for the recovery of the US economy in terms of driving consumption.
Arbitrage Relationship between Bonds and Stocks in the US
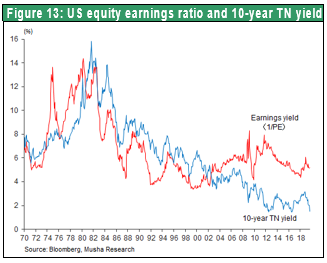
The funds transfer and arbitrage relationship between the Equity and Debt divisions of the capital markets worked well from 1970 to around 2006, just before the GFC. Figure 13 shows the trends in the US S&P500 earnings yield and US 10-year government bond yield. The Lehman Shock collapsed the link between the two and widened the gap. In other words, bonds were overvalued, and stocks were undervalued. However, since 2013, the gap between the two has shrunk, and the linkage has gradually revived and been restored. The only driving force that served to narrow the gap between the two and strengthened the linkage was company share buybacks.
From the above analysis, we can conclude, at least, the following two points.
Conclusion 1: The preferential treatment for Bonds, due to an inappropriate system and policy, caused funds to stay in Debt, causing a bond bubble. Serious reform of this inappropriate financial system is necessary. However, Equity is not a bubble.
Conclusion 2: Only in the United States are capital inflows into Equity occurring as a result of a large amount of share buybacks, thereby avoiding capital stagnation in Debt and zero interest rates. “Japanification” or “Europification” whereby the US falls into zero interest rates will be avoided. The global interest rate decline (= bond bubble) will be stopped by confirmation of an expansion in the US economy and in public spending.