May 15, 2026
Strategy Bulletin Vol.401
Unprecedented Supply-Demand Dynamics and the Sustainability of Japan’s Soaring Stock Market
Can Expansionary Fiscal Policy Boost Japan’s Growth Rate and Drive Future Investment?
A The long-term bull market in Japanese stocks, which began in 2013, had been trending upward at an annual rate of around 11–3%, but has entered a phase of acceleration since 2023. The Nikkei Average rose 28.2% in 2023, 19.2% in 2024, and 26.3% in 2025. Even in 2026, despite the Iran war and a sharp spike in crude oil prices, it has surged 25.7% over the four and a half months through May 13. Compared to the low point following the Trump mutual tariff shock in April 2025, this represents a doubling of the index in just 13 months. It appears the market has entered a new phase. If the market becomes convinced that the Takaichi administration’s expansionary fiscal policy will accelerate Japan’s growth, the Nikkei Average could reach 70,000 yen by the end of the year and 100,000 yen in three years.
(1) The Energy Behind the Grand Bull Market: Exceptionally Strong Supply and Demand
The direct cause of this surge is a rapid improvement in supply and demand. There is a term in the New York market called “FOMO” (fear of missing out), and this situation perfectly illustrates how investors who missed the initial rally are now scrambling to buy stocks. Let us look at the situation among various investor groups. Foreign investors, who account for an overwhelming 60–70% of trading volume on the Tokyo Stock Exchange, are once again driving the market.
This surge is comparable to the 80% rise seen in the first six months of 2013, when Abenomics was launched. At that time, the buyers were exclusively foreign investors, including current U.S. Treasury Secretary Schott Becent, who was then affiliated with the Soros Fund.
Figure1 Cumulative Investment Trends by Investor Type in Japanese Stocks (Since 2011)
Figure2 Cumulative Investment Positions of Foreign Investors (Since 2023)
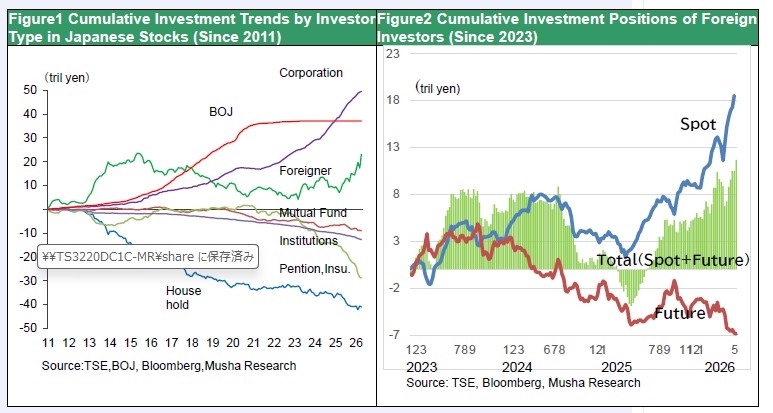
During that period, foreign investors purchased 20 trillion-yen worth of Japanese stocks over two years, but subsequently sold off the majority of their holdings, cooling the frenzy in the Japanese stock market.
Since last year’s Trump tariff shock, these same foreign investors have shifted to a significant net buying position of 16 trillion yen over the past year. However, foreign investors have accumulated 7 trillion yen in short positions in future (as of the end of April), so they are not entirely bullish. If they are forced to close these short positions, that would become a further factor driving stock prices higher.
Figure3: Corporate Buy, Sell of Japanese stocks
Figure4:NISAAccounts and Annual Purchase (SFA)
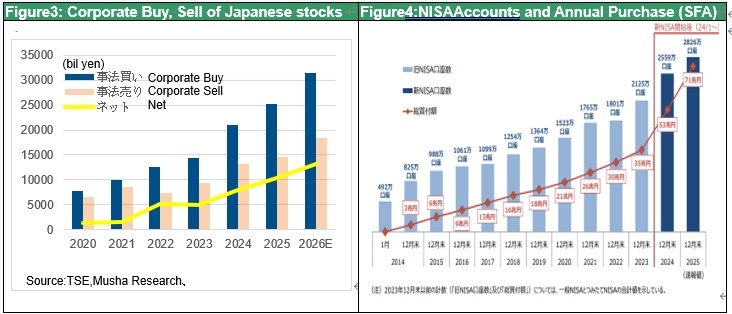
Another key driver of this recent surge is corporate share buybacks. During the Abenomics era, share purchases by business corporations—primarily through buybacks—did not even reach 1 trillion yen annually, but they have surged following the Kishida administration’s introduction of its “New Capitalism” policies. The figures were 12.6 trillion yen in 2022, 14.3 trillion yen in 2023, 21.1 trillion yen in 2024, and 25.2 trillion yen in 2025. As of April 2026, the figure has increased by 25%, and if this pace continues, it will reach 31 trillion yen for the full year. The reasons include requests from the Financial Services Agency and the Tokyo Stock Exchange to correct PBRs below 1x, fears that holding too much cash could make companies M&A targets, and the fact that share buybacks are the most advantageous means of investing surplus funds. Considering that the Bank of Japan’s ETF purchases—the only factor supporting Japanese stocks since foreign investors turned to selling in 2015—peaked at 5 to 6 trillion yen annually, it becomes clear just how significantly share buybacks are underpinning supply and demand.
Retail investors are also emerging as a major buying force. Following the 2024 NISA reforms, new purchases from NISA accounts surged from 5 trillion yen in 2023 to 18 trillion yen in both 2024 and 2025. While the majority of purchases are currently in overseas mutual funds, a shift toward Japanese stocks is likely to occur. Institutional investors, such as pension funds, are also being forced to reduce their allocation to Japanese government bonds and shift toward equities amid entrenched inflation and rising interest rates. Additionally, the government’s call for more aggressive management of public pension funds, such as the Government Employees’ Pension Fund (KKR), is gaining traction.
This favorable supply-demand balance is supported by attractive stock valuations. Stocks offer a dividend yield of 2% and a price-to-earning (P/E) ratio of 5%—the inverse of the P/E ratio—which significantly exceeds the 2.5% yield on government bonds, indicating that they remain extremely undervalued. Yet, 68% (1,100 trillion yen) of Japanese households’ 1,624 trillion yen in financial assets (excluding pension and insurance reserves) is held in cash and deposits with virtually zero interest, while stocks and mutual funds account for a mere 25%—a clearly irrational investment strategy. By comparison, in the U.S., 74% of the $94.5 trillion in household financial assets (excluding pension and insurance reserves) is held in stocks and mutual funds, while cash and deposits account for only 16%. Currently, a serious reevaluation of the Japanese people’s risk-averse investment mindset is underway.
Figure 5: Composition of Household Financial Assets in Japan, the U.S., and the Eurozone (Excluding Pension and Insurance Reserves)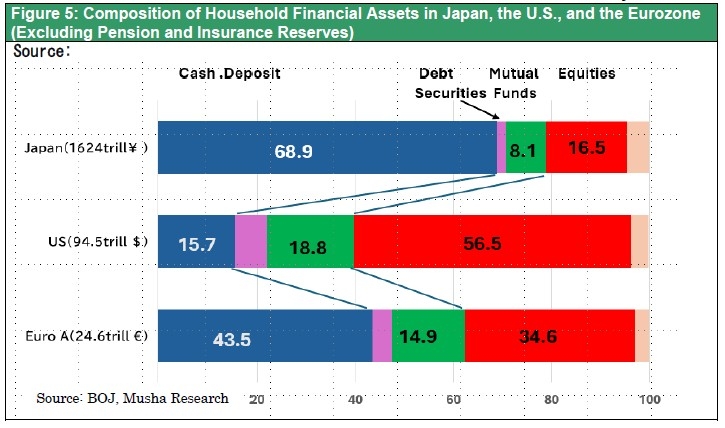
(2) Takaichi’s Conservative Revolution… Can High-Pressure Economic Policies Boost Growth Rates?
That said, the undervaluation of Japanese stocks has remained unchanged for the past decade. So why are people only now realizing this undervaluation and beginning to flock to Japanese stocks? It is likely because expectations are rising that the Japanese economy will finally break free from its prolonged deflation and stagnation.
The starting point for this is a shift in policy. Looking back, every trend reversal in the Japanese stock market has been driven by geopolitical frameworks and policy choices. The major turning points in the postwar era were:
Figure6: Geopolitical Event, Policy and Nikkei Trend
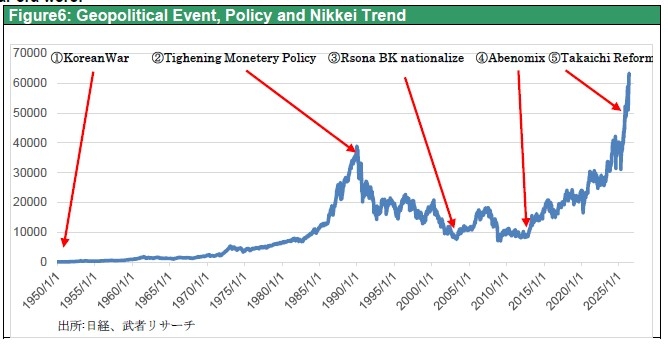
① The outbreak of the Korean War in June 1950 (from a Nikkei average of 90 yen)
② The market peak in late December 1989 caused by monetary tightening to burst the bubble (from a Nikkei average of 38,916 yen)
③ The bottoming out in May 2003 following the partial nationalization of Resona Bank and the completion of non-performing loan (NPL) resolution (from a Nikkei 225 average of 8,117 yen)
④ The major bottom on November 14, 2012, marking the start of the Abenomics transformation following the dissolution of the Diet and general election (from a Nikkei 225 average of 8,664 yen).
⑤ The establishment of the Takaichi administration is expected to mark the formation of the fifth long-term trend since the postwar era.
A major factor was that the formation of the Takaichi administration brought into focus the contours of the conservative revolution she is promoting. When the Ishiba administration was formed in October 2024, stock prices—which had been driven up by expectations for the Takaichi administration—plummeted. In stark contrast, following the LDP’s crushing defeat in the July 2025 Upper House election, which signaled the impending collapse of the Ishiba administration—stock prices began to rise, and the formation of the Takaichi administration on October 20 further accelerated this upward momentum.
So, what exactly did the market expect from Ms. Takaichi? It was the completion of Abenomics, which had ended before its goals were fully realized. When the Abe administration took office, the Nikkei Average surged 80% in six months. However, after 2015, when economic stagnation caused by the consumption tax hike became apparent, stock prices continued to stagnate at an annual rate of 6%, and the market had lost faith in the Abe administration. The 2% inflation target was not achieved, and the exit from deflation and “unconventional monetary easing” was postponed. The greatest disappointment was the continued stagnation in people’s livelihoods.
Comparing the end of 2012, just before the launch of Abenomics, with the end of 2025, total market capitalization has increased 3.9-fold (from 301 trillion yen to 1,192 trillion yen), corporate recurring profits have increased 2.4-fold (from 48.5 trillion yen to 114.8 trillion yen), general account tax revenue has doubled (from 40.9 trillion to just over 80 trillion yen), GPIF accumulated investment returns have increased 7.2-fold (from 25 trillion to 180 trillion yen), and the number of foreign tourists has risen 4.8-fold (from 8.35 million to 40 million), showing remarkable growth. Nominal GDP increased 1.24-fold, the number of employed persons rose 1.09-fold, the female employment rate climbed from 61% to 85%, and the minimum wage rose from 759 yen to 1,021 yen—all representing significant improvements. With the end of deflation, the policy interest rate, which had been at 0%, was raised to 0.75%. The dollar-yen exchange rate, which had been 85 yen, rose to 156 yen.
Corporate business models also underwent a major transformation. The postwar business model of Japanese companies—which had been based on copying U.S. technology and selling products in the U.S. market—shifted strategy toward “Only One” sectors and uncontested “Blue Oceans.” Globalization, driven by the strong yen, also advanced significantly, leading to the emergence of many world-class companies. Due to U.S.-China tensions and the weak yen, global demand began to concentrate on Japan. Corporate governance reforms finally began to establish shareholder capitalism in Japan, and corporate dividends rose from 0.9% of GDP (FY 2000) and 1.8% (FY 2012) to 6.2% (FY 2024), reaching levels higher than those in the United States.
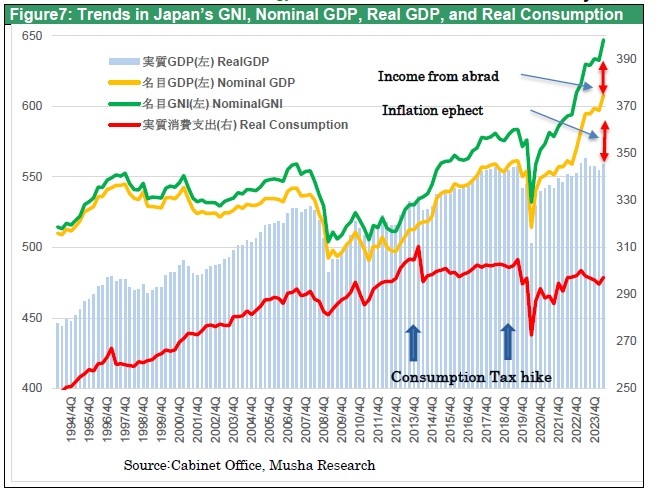
While Japan’s economic earning power has thus significantly recovered and improved, the standard of living for individual citizens remains stuck in the “Lost 30 Years.” Real household consumption stood at 302 trillion yen at the end of FY2012 and 311 trillion yen at the end of FY2013 but declined to 299 trillion yen in Q4 2025 (based on 2020 prices). This is because the “Integrated Reform of Social Security and Taxation,” which was forcibly implemented during a deflationary economy, caused the tax-to-income ratio to surge from 38.8% in FY2011 to 48.4% in FY2022 and an estimated 46.2% in FY2024. Because consumption—the largest component of demand—has remained depressed for a decade, the Japanese economy is stuck with one of the lowest growth rates among developed nations. Comparing the IMF’s April economic outlook (2025 → 2026 → 2027), the United States (2.1% → 2.3% → 2.1%) and the Eurozone (1.4% → 1.1% → 1.2%), Japan (1.2% → 0.7% → 0.6%) lags significantly behind. One factor pushing down real growth is that Japan’s inflation rate has risen to levels exceeding those of Europe and the U.S., reaching 3.2% in 2025 and 2.2% in 2026. However, why has Japan alone seen its real growth rate suppressed to such an extent?
Figure7: Trends in Japan’s GNI, Nominal GDP, Real GDP, and Real Consumption
(3) Can Japan Overcome Its Fiscal Prudence Policy?
The answer lies in excessive taxation. The “Integrated Reform of Social Security and Taxation” implemented since 2012 introduced measures such as increases in social insurance premiums and consumption tax hikes, establishing a system that ensured tax revenue would not be lost even during deflation. However, unexpected inflation caused tax revenue to surge significantly, severely disrupting the economic balance. Since 2021, it has become the norm for tax revenue to exceed the initial budget by 6 to 10 trillion yen. This excess tax revenue amounts to 1.0–1.6% of GDP. Because the government has retained these funds under the guise of fiscal consolidation, it has created significant downward pressure on private demand. In fact, a comparison of general government fiscal balances as a percentage of GDP among G7 countries, as shown in the OECD’s June 2025 Economic Outlook supplementary data, reveals that Japan—which has the lowest economic growth rate—stands out for its reduction in the fiscal deficit. As shown in Figure 8, Japan’s fiscal deficit-to-GDP ratio has remained the smallest among G7 nations, at 4.2% in 2022, 2.3% in 2023, 2.05% in 2024, and 1.6% in 2025. If the tax revenue gains from inflation had been fully returned to households, Japan’s growth would have been closer to that of the United States.
On the other hand, looking at the ratio of gross government debt to GDP (Figure 9) from the same OECD data, Japan’s figure stands at 217% in 2025—the worst in the group. This is a figure familiar to everyone through the media, and it served as the basis for Prime Minister Ishiba’s statement that Japan’s fiscal situation is as bad as Greece’s. Surprisingly, immediately following Ishiba’s remarks, the Nikkei newspaper on August 8 of last year published an article by former University of Tokyo professor Toshihiro Ihori titled “Face Up to the Critical Fiscal Situation,” which cited this chart to argue that Japan’s debt level is the worst in the world—worse even than Greece’s.
Figure8: Fiscal Balance/GDP Trein Major Countries
Figure9: Gross Government Debt/GDP
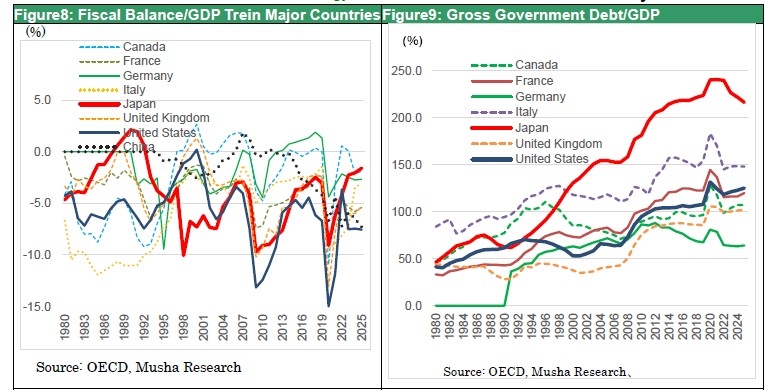
Is Japan’s fiscal situation the worst in the world, or the best among G7 nations? Depending on which indicators you use, the conclusion can be diametrically opposed. However, most people are unaware of the data supporting the former and, based solely on the latter, are convinced that Japan’s finances are on the brink of crisis. This is dangerous.
The reason Japan’s gross government debt is high is that the government holds a massive amount of financial assets. If we compare net government financial debt-to-GDP—excluding financial assets—Japan is in better shape than the United States or Italy, standing at the G7 average. Furthermore, Japan’s net interest payments-to-GDP ratio is the lowest in the world. It can be said that there is ample room for fiscal stimulus and investment.
The effective use of fiscal policy is critically important to the success of the Takaichi administration. First, we must support household consumption, which has been harmed by excessive taxation. The two-year zero-rate on the consumption tax on food policy won public support and led to the LDP’s landslide victory in the recent general election. Ms. Takaichi must urgently implement policies to boost consumer spending through tax cuts and raise Japan’s economic growth rate. If she fails to implement tax cuts and fails to revive consumption, her popularity will decline, and there is a risk that she will lose the elevated political capital.
Second, initiative-taking fiscal spending is essential across all areas: defense, technological research and development, industrial development, and national resilience. Fortunately, in addition to higher-than-expected tax revenues, there are massive hidden investment resources, including foreign exchange gains of 40 to 50 trillion yen from holdings of U.S. Treasury bonds, unrealized gains of approximately 50 trillion yen from the Bank of Japan’s ETF investments, and 180 trillion yen in accumulated investment gains from the Government Pension Investment Fund (GPIF). By effectively redirecting these massive investment resources toward future investments, we can lay the foundation for long-term prosperity.
We must push back against the offensive launched by the Ministry of Finance, academia, and the media, which are fixed on fiscal consolidation. The critical test now is whether we can transform the entrenched economic mindset rooted in the virtues of frugality and a priority on savings. Currently, the National Council on Social Security and its panel of experts are discussing measures to stimulate household consumption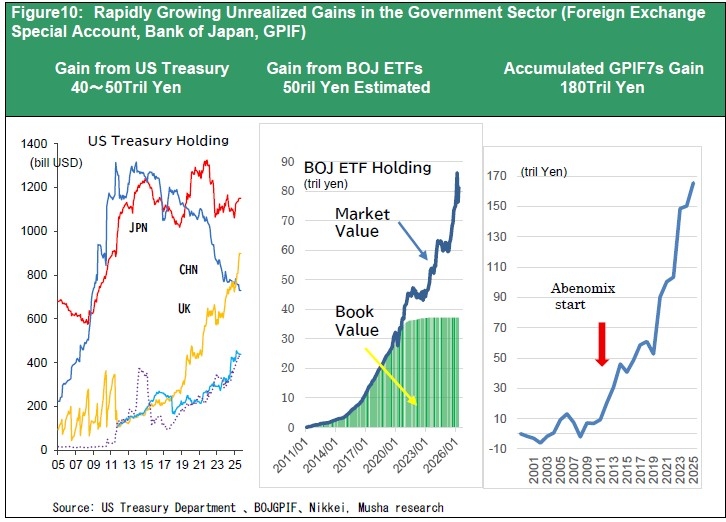 centered on tax credits with cash benefits. If Ms. Takaichi’s responsible expansionary fiscal policy is rendered a mere formality in this process, the risk of a reversal in the surging stock prices will also increase.
Figure10: Rapidly Growing Unrealized Gains in the Government Sector (Foreign Exchange Special Account, Bank of Japan, GPIF)