Japanese stocks have overreacted
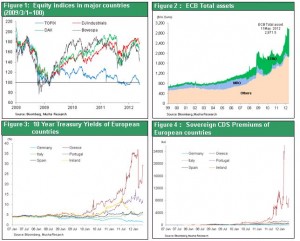
Left-wing political parties that oppose austerity measures gained power in the recent Greek election. As a result, the European currency crisis that appeared to have been extinguished late in 2011 has once again flared up. Investors fear that an exit from the euro by Greece could spread to Spain, Portugal and other countries. Financial markets have thus started pricing in the worst-case scenario of the euro’s demise. Stock prices have dropped worldwide. Even in Japan, almost all of the 20% surge in stock prices since early 2012 has been wiped out even though there are no concerns at all about the Japanese economy or corporate earnings (Figure 1). This downturn is exactly what we witnessed in 2011. However, Greece will hold another election on June 17 because the left-wing coalition that opposes austerity failed to form a government. From every economic standpoint, Greece should accept budget cuts in order to receive debt forgiveness and keep the euro. Public opinion surveys as well show that the majority of the people of Greece want to keep the euro. Apparently, prospects are good for keeping Greece in the euro zone. If Greece does stay, we are very likely to see a strong rebound in stocks worldwide from the recent sell-off. Interest rates in southern Europe, the sovereign CDS spread and the credit risk premium have not increased enough to justify the overreaction by Japanese stocks (Figures 3, 4)
Two differences from 2011: The European safety net and U.S. economy
The stock market this month has moved exactly in line with the common U.S. saying “sell in May and go away.” There are two major differences between now and 2011. But this year, there are excellent prospects for the start of a powerful summer rally in the second half of June. In contrast, there was a prolonged stock market correction in 2011 that finally ended in the fall. First is the ability to ascertain the status of bank assets, which was the origin of the euro zone crisis. The worst-scenario case of a chain reaction of bank failures will not happen because Europe has two safety nets in place: unrestricted loans by the ECB and the European Stability Mechanism (Figure 2). The second difference is the health of the U.S. economy. Most significantly, the housing market is improving and there is now almost no risk of a second bottom.
Figure 1: Equity indices in major countries (2009/3/1=100)
Figure 2: ECB Total assets
Figure 3: 10 Year Treasury Yields of European countries
Figure 4: Sovereign CDS Premiums of European countries

Even if the next Greek election leads to Greece abandoning austerity and the euro, we would probably not see an immediate effect on Spain and Portugal. Loans by the ECB and the European Stability Mechanism would probably stop any spread of the any financial crisis. In France, the new president is Francois Hollande of the Socialist Party. By confirming his commitment at the Camp David G8 to growth-oriented policies, President Hollande has shifted the emphasis of his policies from financial restructuring to economic growth. This stance may settle down financial markets that had been worried about the outlook for growth.
The collapse of financial capitalism scenario – The source of market fears
So exactly why have financial markets lost their self-confidence? The cause is most likely the scenario in which financial capitalism collapses. Difficulties ranging from the collapse of Lehman Brothers to the euro crisis are linked to the same cause: excessive leverage made possible by financial capitalism. There are fears that problems created by this so-called alchemy cannot be eliminated easily. In fact, interest rates have fallen to unprecedented lows in Japan, the U.S., Germany and Britain. Looking only at what happened, the formation and bursting of an asset bubble, subsequent economic downturn and unprecedented downturn in interest rates are precisely what occurred during Japan’s “lost 20 years.” As a result, Japan appears to be ahead of other countries. If this is true, Europe and the United States apparently cannot stop the onset of deflation and prolonged economic stagnation. U.S. stock prices have bounced back about 80% from the bottom after the Lehman Brothers collapse. But the view I just described supports the belief that the U.S. rally is nothing more than a “false dawn” and the largely flat stock prices in Japan are correct.
Surplus capital and people are not a negative after-effect and will instead lead to future growth
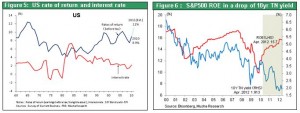
This pessimistic view is based on the inability to explain the extreme gap between profit margins and interest rates (Figures 5, 6). Long-term interest rates have dropped considerably and monetary easing of an unprecedented scale has taken place at the same time. Consequently, it appears that the correct view is that emergency monetary easing has produced excess capital that has nowhere to go. However, companies worldwide are reporting strong earnings. U.S. companies are generated record-high profits only one year after the collapse of Lehman Brothers. Clearly, corporate profitability has improved greatly. Excess capital exists because companies refuse to invest their ample earnings. Furthermore, every time an economic shock occurs, like the end of the IT bubble, the Lehman Brothers collapse and the euro crisis, labor’s share of earnings falls and corporate earnings increase significantly. Companies know how to make money without people or capital, and the result is an excess of these two resources. But this surplus of economic resources has no relation at all with financial capitalism and excessive monetary easing. The reason is that the ability to conserve both labor and capital is the product of the global industrial revolution (the global improvement in labor and capital productivity) fueled by globalization and the Internet revolution.
Therefore, surplus capital and surplus labor have been the source of progress for mankind over the years. That means we are not entrapped in a bad after-effect. Instead, we should view these two excesses as a means of achieving growth in the future. Japan has regarded surplus capital and labor as a negative legacy from prior years. No action was taken to resolve this problem and the result was deflation. Will the United States and Europe go down this same path? I believe there is no need to adopt a fatalistic view.
Figure 5: US rate of return and interest rate
Figure 6: S&P500 ROE in a drop of 10yr TN yield

Massive private-sector savings will slowly create demand
U.S. companies continue to announce record earnings. Furthermore, private-sector saving is at an all-time high as well. For instance, the household saving rate has surged from the 1% level after the Lehman Brothers collapse to the current 4%. Companies are directing a large share of their surplus funds to buying back stock. Repurchases of stock have increased to 4% of market capitalization. When the U.S. stock market dividend yield of 2% is added, the result is return of earnings to shareholders that is equal to 6% of market capitalization. But demand and employment are lackluster. Before the Lehman Brothers collapse, there was too much consumption. But now there is not enough. Housing investment peaked at 6% of GDP before the collapse but has since dropped to the current 2.3%. Moreover, automobile sales are still low by historical standards at an annual rate of about 14 million. Slumping demand is not caused by a shortage of capital. The real cause is a problem with consumer sentiment that makes people save more and spend less. There is a saying in Japan to the effect that “a man cannot give what he hasn’t got.” The United States today has much but refuses to give much.
The keys to improving sentiment: An improving housing market and a sharp drop in inventories
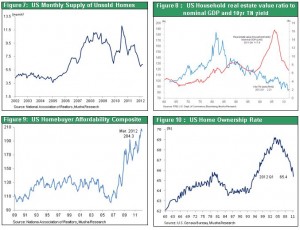
Clearly, the outlook hinges on the ability to eliminate the factors that are suppressing consumer sentiment. The decisive factor will be a reversal of the soft housing market that has been weighing down sentiment for many years. Inventories of houses for sale have declined significantly. Foreclosed houses have been pushing down home prices, but the number of months of home inventories has dropped sharply (Figure 7).
Furthermore, houses are extremely underpriced from a variety of perspectives. For example, the house price-rent ratio is now at an all-time low. Another key indicator is the current value of household real estate holdings in relation to the nominal GDP. This ratio increased from 1.2 in the 1990s to a peak of 1.9 in the past decade only to fall back to the current 1.2 (Figure 8). The home affordability index was 120 to 140 during the 1990s. During the subsequent housing market bubble, this index fell to 100 but has now rebounded to the 200 level, which is a record high (Figure 9). The unprecedented drop in mortgage interest rates is another sign that now is an excellent long-term opportunity to buy a house.
A home ownership ratio bottomed out
A home ownership ratio that peaked at almost 69% was a primary but hidden cause of the deterioration in the supply-demand balance in the housing market. Today, the ratio is all the way down to 66% and signs indicate that this is probably the bottom (Figure 10). The Clinton and Bush administrations took actions aimed at creating a society of home owners. The resulting boom in home buying pushed the ownership ratio up. Sub-prime loans made homes affordable for low-income households, too. But the end of the housing market bubble caused the home ownership ratio to plunge and the supply-demand balance to worsen. However, home ownership still offers the same tax and financial benefits. As a result, the U.S. housing market should hit bottom at some point and start to rebound. A recovery in the home ownership ratio started in 1984 following a downturn. There is reason to believe that the same recovery will begin in 2012, too. Consequently, now that an unmistakable improvement has started in the housing sector, which was at the center of the financial crisis, there is an even greater possibility of a U.S. economic resurgence with no deflation.
Figure 7: US Monthly Supply of Unsold Homes
Figure 8: US Household real estate value ratio to nominal GDP and 10yr TN yield
Figure 9: US Homebuyer Affordability Composite
Figure 10: US Home Ownership Rate

 Even if the next Greek election leads to Greece abandoning austerity and the euro, we would probably not see an immediate effect on Spain and Portugal. Loans by the ECB and the European Stability Mechanism would probably stop any spread of the any financial crisis. In France, the new president is Francois Hollande of the Socialist Party. By confirming his commitment at the Camp David G8 to growth-oriented policies, President Hollande has shifted the emphasis of his policies from financial restructuring to economic growth. This stance may settle down financial markets that had been worried about the outlook for growth.


