Dec 09, 2021
Strategy Bulletin Vol.296
US monetary policy outlook for 2022 and the evolution of equity capitalism in the US
2022 will continue to be a bright year for the economy and markets. The normalization of the COVID-19ry pandemic will continue, innovation will accelerate, mild inflation will continue, and friendly monetary policy will continue to promote risk-taking.
Uncertainty around markets has disappeared. The confrontation between the US and China remains fierce, but on the economic front it has become more like a war of attrition and less uncertain. The COVID-19ry pandemic has not been brought under control, but its negative impact on the economy is diminishing. Major political events, such as the US presidential election, have run their course. The biggest uncertainty may be the theory of a US stock bubble.
(1) Do not call it a bubble so easily
The genuine bubbles were in the US in 1929 and in Japan in 1989
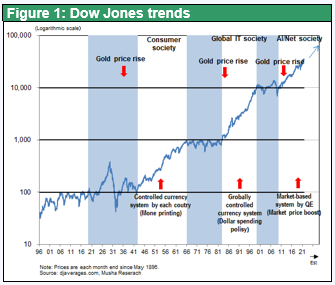
It would be better not to use the word "bubble" too often. Two real bubbles in modern capitalism were in the US in the early 1929s, just before the Great Depression, and in Japanese stocks in 1989. The other two, the bursting of the IT bubble in 2000 and the GFC in 2008, were not bubbles, although they did cause stock prices to fall. In both 2000 and the Lehman Brothers collapse in 2008 and later, share prices regained their previous peaks in the years that followed. It is clear in retrospect that the stock market rally was sustainable. Even amid the 2008 crash, Musha Research was the only Japanese researcher to continue to argue that the stock market was not in a bubble. We were correct in asserting that there was no substantive basis for a stock market crash, even though it happened to be the result of a misunderstanding between policy and public expectations that caused buyers to evaporate. Why were there two bubbles, one in the US in 1929 and the other in Japan in 1989? There are two reasons: the first is the loss of earning capacity, which is a precondition for severe recession; the second and more important reason is the reversal of the policy regime.
The second and more important reason is the reversal of the policy regime, the neglected credit crunch
Behind the crash in the United States after 1929 was a credit crunch that followed the gold standard. It was not possible to reverse the credit crunch by remaining tied to the gold standard. The reason for the collapse of Japan's stock market bubble in 1989 was that the land standard, which had been at the heart of Japan's credit creation, had completely collapsed and the central bank had supported it, leading to a credit crunch triggered by falling land prices that lasted for years. So, what are the conditions for that now? First, earning power is extremely strong thanks to the digital revolution. And regarding the financial regime, the Fed Chairman Jerome Powell and the US Treasury Secretary Janet Yellen are two of its supporters. It is likely that they will continue to maintain a framework that encourages credit creation and supports risk-taking. In this light, we can conclude that US equities are not in a bubble. In the following, we will explain the reasons for this conclusion in more detail: first, the long-term trend of lower interest rates and friendly monetary policy is expected to continue in 2022, and the Goldilocks market is expected to continue; second, what we see as a new capitalist movement is emerging in the US.
(2) U.S. financial conditions in 2022: high inflation will not stick
The first reason to be optimistic about the financial environment in 2022 is that the current inflation is transitory, and the second reason is that the long-term trend of lower interest rates will continue to anchor the economy and finance. The risk is that the media and policymakers will become increasingly frustrated with short-term inflation and that excessive tightening will trigger a temporary financial shock.
US inflation is transitory
The current inflation is mostly due to supply constraints caused by disruptions in the supply chain. The COVID-19 disaster caused easy job cuts, which led to a shortage of truck drivers and a halt in the circulation of containers. This has resulted in ships full of containers being stuck outside ports. Economic history teaches us that supply chain problems such as this - price rises caused by supply constraints - cannot be contained by monetary policy. Tightening monetary policy to induce a contraction in demand will not erase supply-side constraints. US policy leaders and markets understand this.
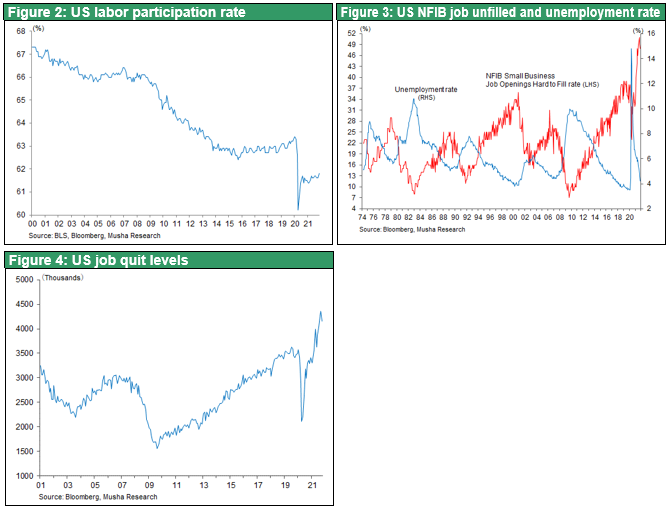
If there is indeed going to be sustained inflation, it will be a spiral of higher wages and higher prices. Let's consider whether wages can start to rise indefinitely. Figure 2 shows that the labor participation rate has fallen from 63% before COVID-19 to 60%, and although it has recovered, it is still in the 61% range, meaning that half of the workers who left the labor market have not returned. It means that there is plenty of potential labor surplus. Curiously, however, the job unfilled rate for small and medium-sized enterprises (SMEs), as shown in Figure 3, is at an all-time high, indicating that companies are experiencing an unprecedented level of difficulty of obtaining employment. Moreover, as Figure 4 shows, the number of people leaving jobs in the US is not just at pre-COVID-19 levels, but at an all-time high. How do we make sense of this inexplicable phenomenon? It could be argued that workers have more choice and are beginning to choose their jobs based on pay and working conditions.
Workers choose their jobs, joblessness is local
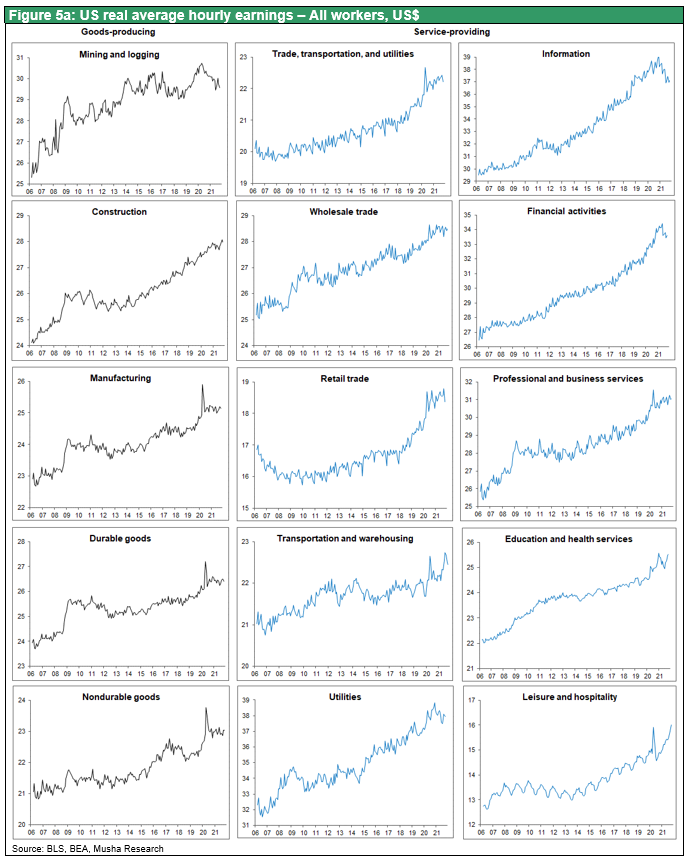
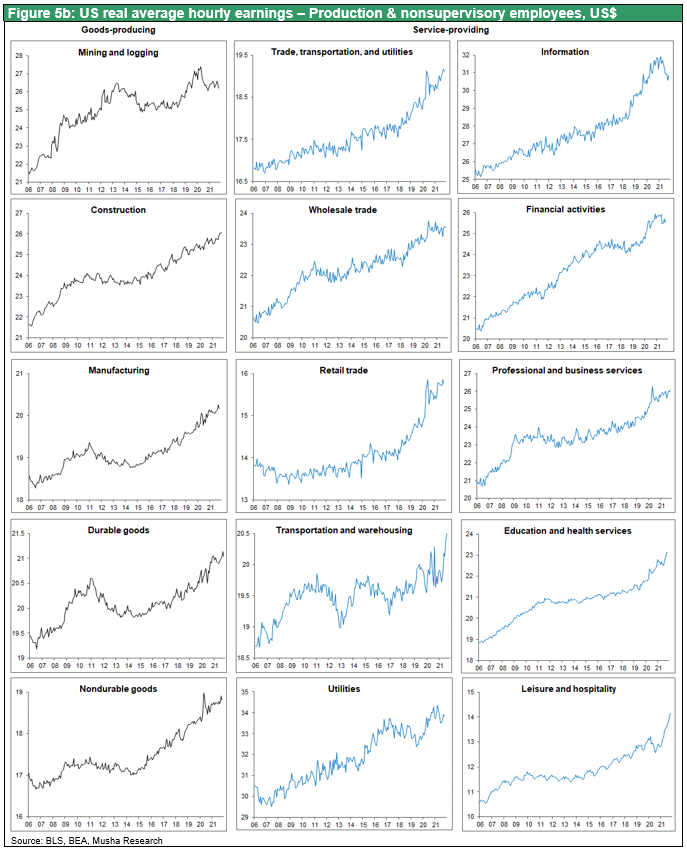
This is not the case in all areas of work, however, and is now a local phenomenon. When we look at real wages by sector, we see that, overall, neither manufacturing nor services have yet started to see an upward trend in wages. However, when looking at the sub-sectors, wages have risen rapidly only in the transport and warehousing and entertainment sectors. Within these sectors, the salaries of non-managerial and non-managerial workers, such as truck drivers and waiters in restaurants, have risen sharply. On the other hand, regular office work has been made less labor intensive by the development of computers. The US labor market is experiencing an optimization of labor allocation in the new working environment. The general tightness between labor supply and demand is not a condition for general wage inflation.
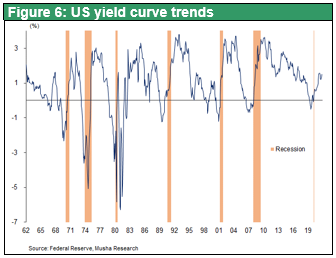
We need to be wary of premature monetary tightening. The market was shocked by premature monetary tightening in February and October 2018. The flattening of the yield curve in the process of raising policy rates was followed by a stock market shock. Before the sharp fall in February 2018, interest rates were raised five times. In the US stock market, there is a saying that three steps and a stumble means that up to three rate hikes are okay, but after that stocks will plummet. In other words, the yield curve and the number of interest rate hikes should be watched.
(3) The long-term trend of lower interest rates is continuing, and the upward effect on stock prices will continue
Why does the Greenspan conundrum persist?
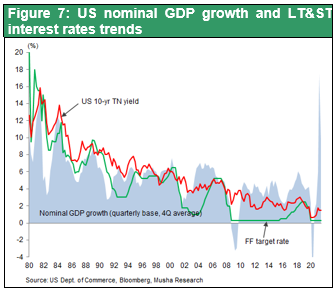
The long-term interest rate in the US was 15% in early 1980’ and fell to 0.5 in August last year. It has been the most important anchor of the US financial markets, driving up stock prices and house prices. Many people thought that this long-term trend of falling interest rates was over and that interest rates were about to rise. Last year, Musha Research argued the same thing. However, the current situation suggests that this long-term downward trend in interest rates may not be over. The yield on the US 10-year Treasury notes, which rose to 1.7% in March this year, has since fallen to below 1.2% and is still hovering around 1.4% despite the prospect of a tapering and an earlier rate rise. In 2005, Greenspan called long-term interest rates a "conundrum," and they remain one of the biggest focuses of today.
Why has the natural rate of interest continued to fall?
The natural rate of interest, or the neutral level of real interest rates that neither accelerate nor decelerate the economy, is the theoretical measure of the downward trend in interest rates. The natural rate of interest, measured by the Federal Reserve Bank of New York (shown in red in Figure 8,) fell to zero immediately after breaking out of COVID-19 pandemic. The fact that the US real interest rate (TIPS = yield on price-indexed government bonds)has fallen sharply, and has languished below -1% for more than a year suggests continuous fall of the natural rate of interest since it has been linked to the natural rate of interest, even though NY FED has stopped to report the number.
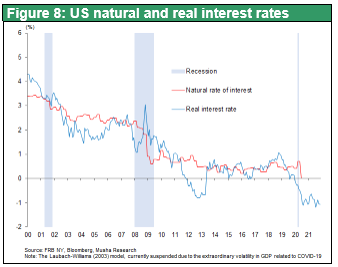
In other words, the downward trend in interest rates did not end with COVID-19 pandemic but is likely to continue even after COVID-19. If the downward trend in interest rates continues, then there is still room for stock prices to rise (room for valuations to rise) and stocks can be bought from here.
Why have interest rates fallen so much over the long term? And what will happen now? Many people saw the decline in interest rates as a sign of a downturn ahead, but that view was clearly wrong: after 40 years of falling interest rates, a booming economy, and an underlying rise in stock prices, there is no way to say that the decline in interest rates was a sign of a recession. Some have even suggested that the fall in interest rates was a bond bubble. A bond bubble would mean that interest rates would rise sharply, and the bubble would burst, but this has not happened for some time. Many of the bond fund managers who have been talking about the bursting of the bond bubble have been found to have failed in their management.
Money glut caused by rising capital productivity
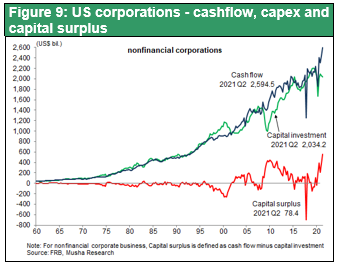
What, then, is the cause of this prolonged decline in interest rates? Although there is no clear theory, Musha Research believes that the reason behind this decline in interest rates is a significant money glut. The reason for this is the rise in capital productivity. Many people are aware that the DX revolution, with its use of computers and the internet, has led to a huge increase in labor productivity, allowing more work with less workforce. It is important to note, however, that there are two types of productivity in an economy: labor productivity and capital productivity. The productivity of two main resources of the economy, labor, and capital, have been increased by the new industrial revolution. To be more specific, a computer that cost a billion yen 10 years ago probably costs less than 100 million yen today. The fact that the price of a computer has fallen by a factor of ten means that the efficiency of the capital used to buy a computer with the same functions has increased tenfold - this is the increase in capital productivity. As the increases in labor productivity has led to an excess of people, the increase in capital productivity has led to a surplus of money. And this surplus of money may have caused the long-term trend towards lower interest rates.
In fact, Figure 9 shows that the cash surplus of the US corporate sector (exclude finance), i.e., the cash flow that far exceeds capital investment, has been remarkable since the 2000s. And since COVID-19 pandemic the corporate sector's cash surplus has risen even further. If this is the case, then the current trend of falling interest rates is quite sustainable, and there is a rationale for buying stocks based on low interest rates.
If interest rates fall, the upside for stock prices is large
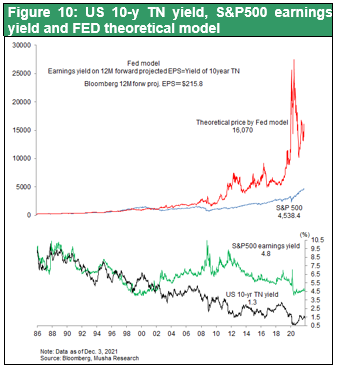
I would now like to explain the relationship between stocks and interest rates. Figure 10 shows the yield on the SP500 and the yield on the 10-year Treasury bond. Up until 2000, the correlation was that if long-term interest rates were 10%, the yield on equities was 10% and the P/E ratio was ten times. Since 2000, however, interest rates have fallen sharply but equity yields have not moved at all, indicating a gap between bond and equity variations. The top half of Figure 10 shows theoretical share prices based on the FED model. Before 2000, this formula was about right. If we now assume that the FED model is valid and calculate a reasonable share price, then if long-term interest rates in the US are 1.5% and we buy shares at a yield of 1.5%, a reasonable SP500 would be 14,700 points, three times the current level of 4,700 points. If we assume that interest rates are falling, there is a lot of room for upside.
In the past few years, TINA has become a watchword in the US stock market: "There is no alternative", indicating that investors are having trouble managing their money and have no other rational investment options.
(4) Equity capitalism is evolving in the US
When we think about finance in the United States, particularly equities, we come to the hypothesis that capitalism in the United States is evolving to a new stage.
The stock market has changed from a place for raising money to a place for returning income
First, the role of the stock market has changed. In the past, the role of the stock market, or more broadly of the financial markets, was primarily a circular one: banks would take household savings as deposits and then lend the money to companies for investment. In the US today, however, corporate profits are returned to shareholders in the form of shares, and the money returned to shareholders becomes the starting point for a variety of economic cycles.
The Flow of Funds Begins with Shareholder Returns
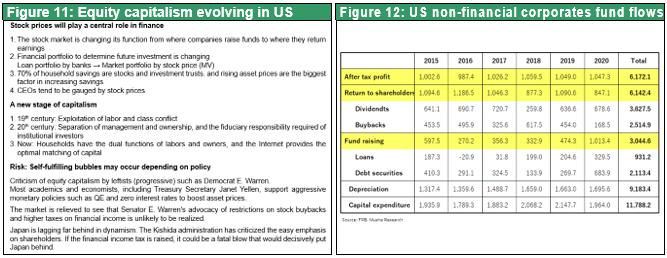
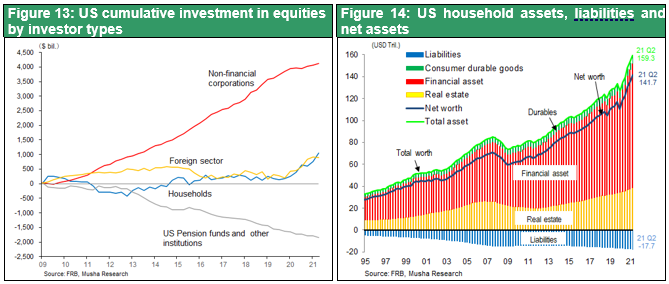
Figure 12 shows the flow of funds in the U.S. corporate sector (excluding financial institutions) over the six-year period from 2015 to 2020. Total profits were $6.17 trillion, and how much of this was returned to shareholders? Surprisingly, U.S. companies return their entire profits to shareholders. The stock market used to be a place for corporations to raise funds, but now it has become a place for corporations to return income to shareholders. This corporate buyback or shareholder return has led to a significant increase in stock prices and a significant increase in household savings. Figure 13 shows the amount of net investment in stocks by entity in the United States since the GFC. The only thing that has caused a significant seven-fold increase in stock prices during this period has been corporate share buybacks. Pension funds and other institutional investors were heavily oversold, while households were mostly on the sidelines. Figure 14 shows the balance sheet of U.S. households, and the blue line shows net worth, which increased from $56 trillion in the 1Q 2009, the period immediately after the Collapse of Lehman Brothers, to $14.1 trillion in the 2Q 2021, an increase of $85 trillion in 11 years. $85 trillion is four times the size of U.S. GDP. This massive increase in assets has been the most important engine that has enabled U.S. households to spend aggressively. This is a departure from the traditional equity capitalist framework.
Market capitalization portfolios will determine future investment
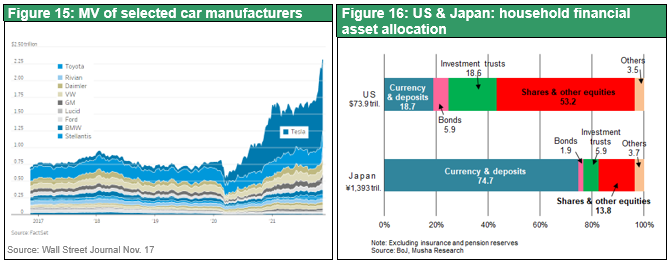
Second, the investment drivers that determine the future have changed dramatically. In the past, banks determined future investment through their loan portfolios. Bankers would lend to a company, manager, or product because they saw potential in it, and investment would start there, triggering a virtuous cycle. Now, however, the era of investment based on bank loans is over, and future investment is instead determined by the market capitalization portfolio of stocks. Companies with high stock prices automatically have strong financial power, which makes it possible to invest automatically and achieve the future growth envisioned by their stock prices. This is clearly seen in the automotive industry, for example. As shown in Figure 15, Tesla's market capitalization is now over $1 trillion, three times that of Toyota. Tesla, with such a strong market capitalization, raises funds in many ways and invests in all directions. This kind of strong investment makes Tesla even stronger, and the market capitalization portfolio is shaping the future.
Dividends and price gains are the largest means of increasing savings
Furthermore, household savings in the U.S. have increased due to rising stock prices and dividends. Figure 16 shows the breakdown of household financial assets excluding pension insurance reserves in Japan and the U.S. In the U.S., 72% are stocks and investment trusts, while cash and deposits account for only 18.7%. Dividends and gains from price increases have overwhelmingly contributed to the formation of household assets. Japan is the complete opposite, with less than 20 percent invested in stocks and 75 percent in cash and deposits, which means that Japan lags far behind the equity capitalism of the United States.
The consequence of all this is that corporate managers are evaluated by stock prices in the US. In other words, stock-price-centered finance is now an established reality in the United States’ capitalism.
Looking back, capitalism has undergone major transformations.
- After the Industrial Revolution in the 19th century, the United Kingdom was the era of classical capitalism as depicted by Karl Marx, where workers were exploited, and class conflicts worsened.
- In the 20th century, however, ownership and management were separated in the United States, and managers emerged as technocrats. In addition, the shareholders had been shifted from a small number of wealthy people (capitalists) to institutional investors who combined many small funds. We have entered an era of fiduciary responsibility, in which institutional investors were entrusted by shareholders to monitor management. The conflict between those who have capital and those who do not has faded into the background.
- Now, we seem to be entering a new era in which households are both workers and shareholders (owners), and the Internet is the optimal match for capital.
(5) Risk is a policy to deny equity capitalism
If the theory of stock price bubbles is accepted by policy, it will become a self-fulfilling bubble
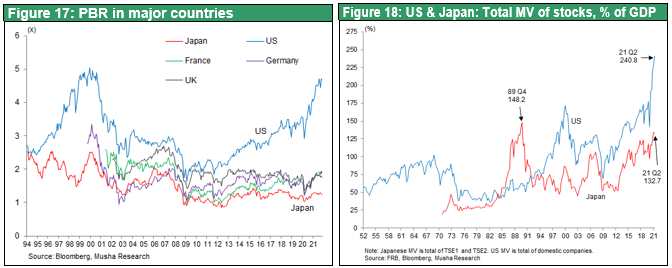
Stocks are risky assets that fluctuate wildly. Some people argue that this makes them undesirable as a savings vehicle. Also, stock prices in the U.S. have a P/B ratio of four times, which is outstandingly high among major countries. Furthermore, the ratio of total stock market capitalization to GDP in the U.S. is 240%, a significant deviation from the historical average. From this perspective, it is not surprising that U.S. stock prices appear to be in a bubble. The question then is whether this is a bubble that will collapse. What should we look for? If we recognize that this is a bubble and that it is dangerous, and if we adopt a policy that restricts and prohibits stock-oriented finance, stock prices will crash and we will have a major recession, and then we will be able to say that this was a bubble. This is what the leftists, the so-called progressives, such as Elizabeth Warren, a Congress woman of the Democratic Party of the United States, are advocating. They are trying to change the financial system by curbing stock buybacks and increasing taxes on financial income. Fortunately, that argument is not supported by U.S. policymakers, markets, or many economists. Therefore, the current stock-centered financial system in the U.S. will continue, and as a result, the stock market will continue to rise. Of course, there is enough value creation in profitable companies to justify high stock prices. Therefore, Musha Research claims that the situation is fine. However, we should be wary of any political moves to change this stock-oriented financial system in the future.
In Japan, the Kishida administration is proposing a new kind of capitalism. However, the new capitalism that the Kishida administration is advocating is completely different from the equity -capitalism that is currently developing in the United States. Rather, it is likely to include some of the policies advocated by those on the left, such as Elizabeth Warren in the United States. It is important to watch Japan's financial policies in 2022.
We need policies to solve its permanent capital surplus
Finally, while it is desirable for the framework of equity capitalism to be preserved and developed, it is important to ensure that a permanent money surplus is to be cared so that not to inflow into equity market and become speculative. The essential solution is to increase the growth rate, eliminate the money surplus, and create an environment in which interest rates can rise. This will require the creation of demand through fiscal policy, the construction of social safety nets such as universal basic income, and green investment. This will be necessary to correct the excessive bias toward investment in the stock market. This is an era in which expectations for politics and policy are rising sharply.